
 astronaut
 Pearl
Pearl Zcash
Zcash Walrus
 NEAR Protocol
 Starknet
 Pudgy Penguins

Dogecoin is trading near $0.10 as traders watch a tightening range on lower timeframes and a key support band on higher timeframes. Several charts shared today indicate DOGE crypto is nearing a significant monthly close while sitting in a long-term “best buy” area. At the same time, there is compression in the short term showing which often precedes a stronger directional move.
Dogecoin Price Shows Key Support Zone Near $0.10
Trader Tardigrade’s monthly Dogecoin chart revealed a price holding a level marked as a “best buy” area. The post framed the setup around the monthly candle close and suggested the level remains intact. The chart also displayed an increasing green support band that has served as a structural floor in previous cycles.
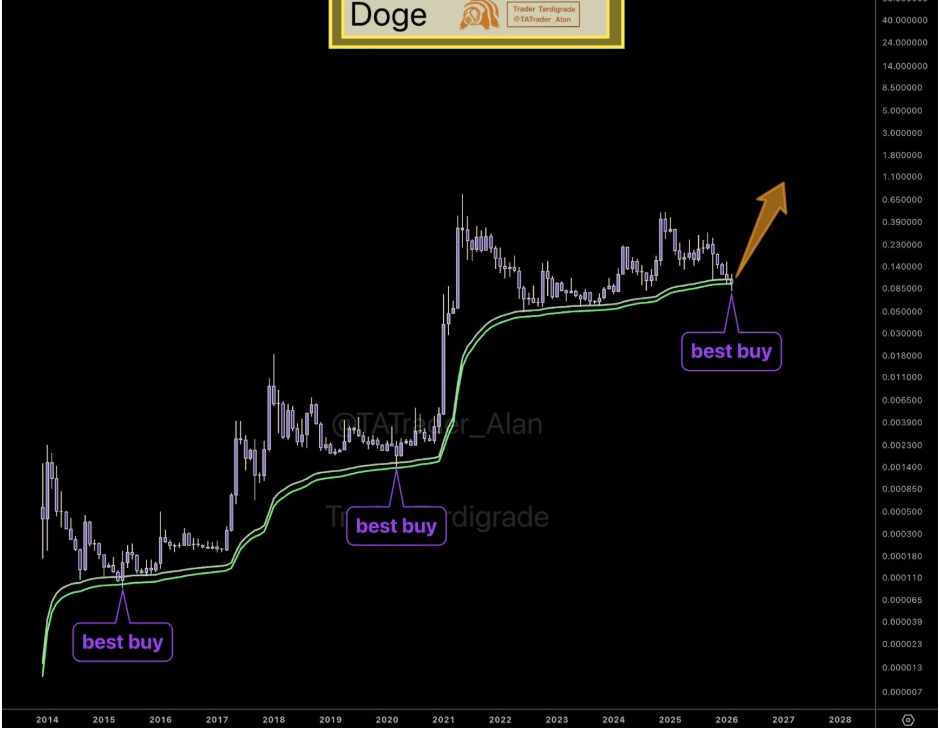
On the same monthly chart view, the previous peaks and long consolidations of DOGE were visible above the current price. The arrow projection for the chart was higher and suggested upside potential from the base, continuing to hold. However, the key message was about location, not timing, and the focus was on Dogecoin staying in the close at the marked zone.
This monthly framing is important because it zooms out from the daily noise. When DOGE crypto is in a multi-month base, traders often look to be confirmed by the next impulse leg. Still, the market will require a near-term structure as well to conform to that bigger picture.
BTC 4H Triangle Tightens as Breakout Risk Builds
More so, Trader Tardigrade also posted a four-hour chart labeled a contracting triangle. The chart revealed converging trendlines, with highs declining and lows rising. That structure is usually an indication of compression in volatility contracts.
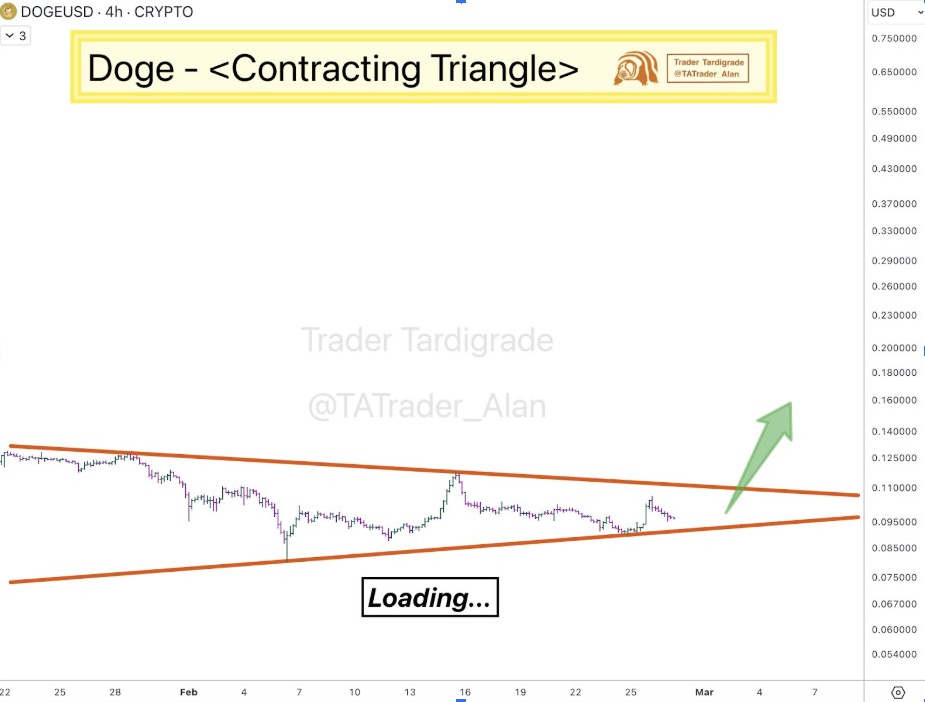
The chart suggested Dogecoin price is “loading” as it approaches the apex of the triangle. A green arrow projected a possible breakout path after the price breaks out of the range. Still, direction is not assured, and trading is watched for a decisive move beyond one of the boundaries.
The triangle is around the $0.10 region of the scale shown. As a result, the $0.10 handle is still an important pivot for short-term sentiment. A break above the top trendline could shift attention back to overhead resistance zones.
If DOGE crypto broke down instead, traders would look for the lower trendline to fail. That would bring previous local lows back into focus. The triangle’s tightening range suggests a sharp move to follow.
Short-Term Bounce Fades Below Resistance
KrissPax explained a V-shaped recovery, with DOGE peaking around $0.105 before profit-taking. The post said the move did not gain long-term support following the spike. It also suggested traders are watching for a broader-based rally across crypto.
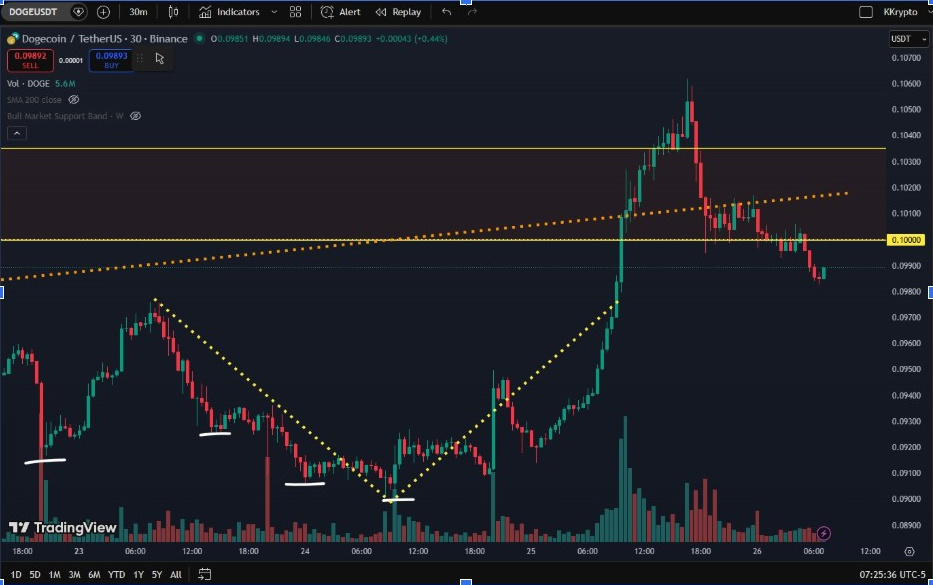
A chart supported that story with an extreme vertical move upwards, followed by a pullback. Price action revolved around a highlighted $0.1000 level after the spike. A dotted rising trendline also appeared overhead, marking a gradual slope that the price struggled to reclaim.
This structure implied that DOGE is still digesting the move and not trending cleanly. Traders often consider failed holds around $0.105 to be an indication of supply overhead. Therefore, DOGE may need more volume to get that area back and maintain momentum.
Even so, price holding around $0.10 prevents the market from sliding lower into a deeper breakdown. That balance between the bids at $0.10 and the supply above $0.105 aligns with the compression signals seen on the triangle chart.
DOGE Weekly Support Zone Sits Near $0.08
Meanwhile, Surf shared a weekly DOGE chart pointing to support confluence around the 0.786 Fibonacci level. The chart labeled 0.786 near $0.080632 and framed it as a level that held strong. It also mentioned a double bottom structure as well as an uptrend line meeting around the same area.
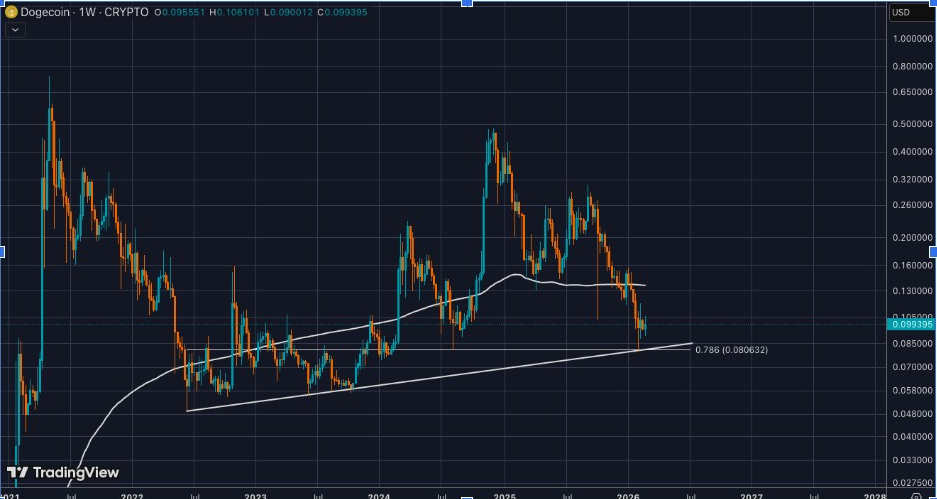
The same post suggested sub-$0.10 levels remain attractive in the broader context. It also noted that anything below the 200-week moving average is a favorable long-term area. On the chart, the 200 WMA was above the current region, serving as a longer-term mean reference.
This weekly framing includes a downside map if short-term structures fail. If DOGE crypto falls below $0.10 and breaks the triangle lower, the next area of interest is the $0.08 level. That level comes in both Fibonacci support and trendline confluence.




