
 astronaut
 Pearl
Pearl NEAR Protocol
 Walrus
 Zylo Ecosystem
 Bitcoin
 Hyperliquid

Dogecoin price was back in the limelight after several chart analysts called fresh technical signals. Traders followed the alerts as the DOGE price approached multi-month lows.
The setups emerged during a wider crypto pullback, which kept sentiment cautious. Even so, a cluster of signals sent Dogecoin price back on watchlists.
Liquidity remained thin, so small flows moved the price quickly today. Derivatives funding cooled, and therefore, liquidation pressure reduced across DOGE. Derivatives funding cooled, and therefore, liquidation pressure reduced across DOGE.
TD Sequential Signal Highlights Short-term Exhaustion of Dogecoin Price
Analyst Ali Charts identified a TD Sequential buy setup on the Dogecoin daily chart. The signal was printed after a series of strong red candles. Dogecoin price dropped close to the $0.095 area on the chart. It formed this level as part of its recent trading action.
That level is near recent intraday lows. The TD framework can often identify potential trend fatigue after more prolonged selling. Therefore, traders looked out for a pause or bounce instead of a complete reversal.
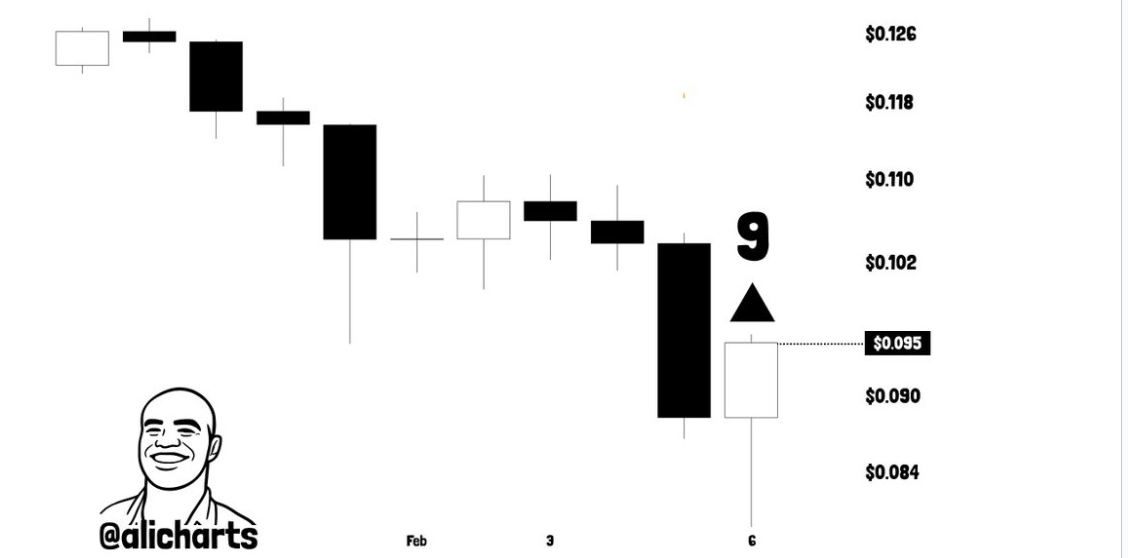
DOGE price still shows lower highs on the daily timeframe. Sellers also defended rebounds from the previous week. As a result, confirmation is the key variable. A stronger close above nearby resistance would help to validate the setup.
However, another sharp leg down would render the short-term optimism invalid. Traders also kept an eye on Bitcoin‘s direction, which is often the driving force behind meme coin beta.
Monthly Demand Zone Attracts Attention for Accumulation
Analyst Crypto Patel pointed to a higher timeframe perspective with the monthly DOGE/USDT chart. The post referred to Dogecoin price as trading into monthly demand following a deep macro drawdown.
The area is an area of re-accumulation, not a breakout. It also suggested that previous downside pressure might have finished its major phase of correction.
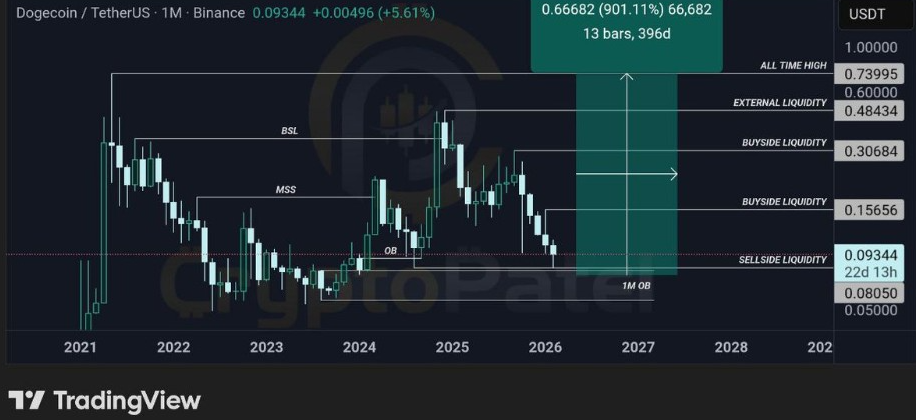
The same chart indicated a wide range with a base near the $0.055 level. That zone falls in line with historical support from previous cycle consolidations. Dogecoin price is still far from its previous all-time high.
Out of this, long-term holders are therefore looking at base building and liquidity recovery. The monthly candle structure also displays wide swings, which are in line with DOGE’s history. For that reason, noise is expected by the trader before any durable trend change.
PMO Indicator Reflects Previous Cycle Lows
Furthermore, analyst Bitcoinensus posted a momentum view with the PMO indicator on several Dogecoin cycles. The chart showed the PMO line falling below a point previously in tandem with major bottoms.
Similar momentum troughs appeared around 2017 and 2021 on the same graphic. The post related the pattern to a model of a three-phase cycle. That model goes from downtrend to slow grind to acceleration.
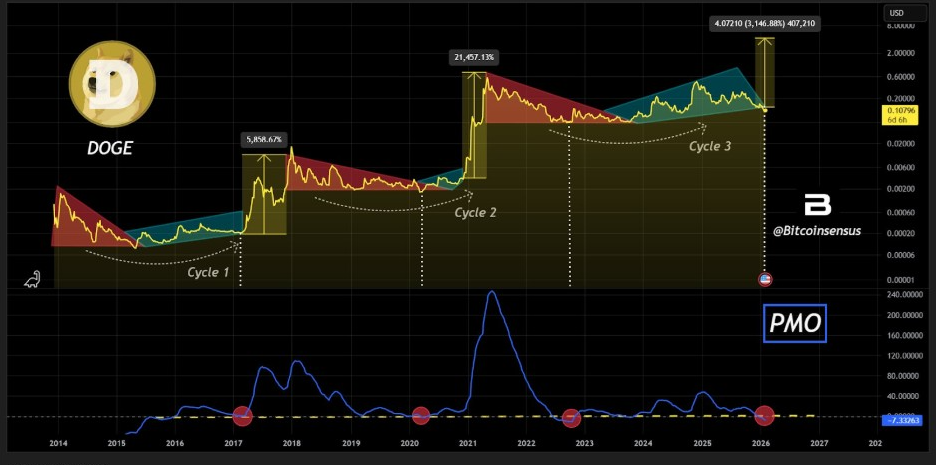
Momentum signals can be used to improve timing, but they require price confirmation. Dogecoin price needs to be supported while buyers absorb supply. Otherwise, momentum may remain weak for longer than anticipated.
Traders also monitor the liquidity situation and risk appetite in the marketplace. If volatility increases, the DOGE price may tend to bounce more quickly than large caps. Therefore, the PMO signal raised interest but did not settle on a direction.
Dogecoin Price at a Critical Channel Support
Meanwhile, analyst Cryptollica added a structure view of Dogecoin using a long-term channel chart. The graphic puts Dogecoin price near the bottom of a multi-year range.
It was also a midline where previously the price struggled. Repeated red arrows on the chart indicated several failed rallies. Those failures formed stratified resistance over existing levels.
At the same time, the chart depicted past rebounds from the channel base. That history makes buyers attentive to supporting.
Still, the DOGE price has not recovered the midline, which holds back bullish conviction. A move back above previous swing highs would improve the trend profile.



