
 Bitcoin
 Aerodrome Finance
 Zerebro
 Starknet
 Zama
Zama Pearl
Pearl ZKsync
- The Pundi X coin price is favorable, around 5.0% during intraday.
- The 24-hour trading volume is at $22 million.
- PUNDIX/BTC pair is trading positive by 2.0% at 0.00003046 BTC.
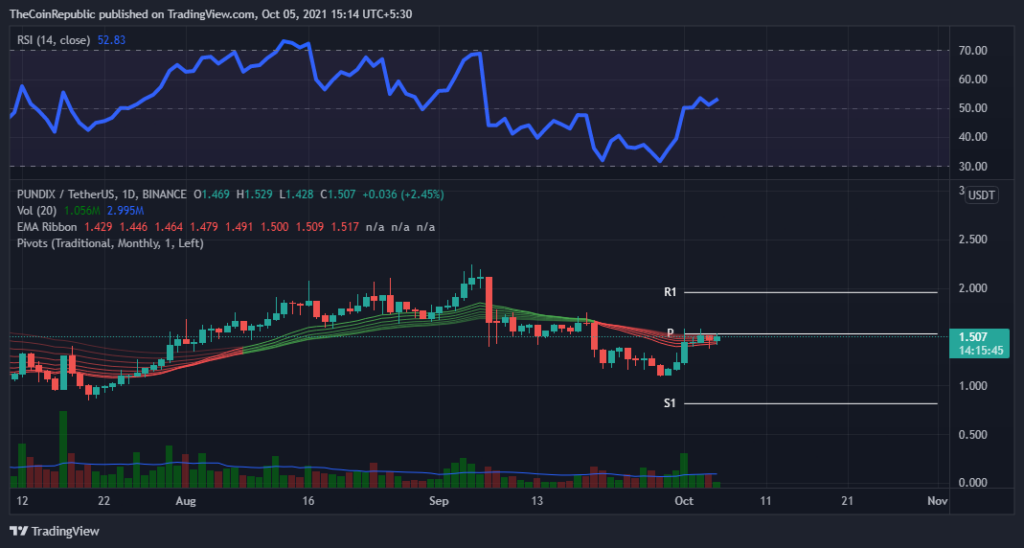
The daily technical chart and price trend of Pundi X coin show a bullish trend. Based on the pivot point, the first support zone is 0.80 USDT. Another way to watch it is that if it rushes, the resistance level to look at is 2.0 USDT. Therefore, the chart created a bullish harami candlestick pattern during the day, and the cost is confident that it will remain positive with unwavering median strength.
The Exponential Moving Average (EMA) band, consisting of various EMA’s, strongly supports currency price fluctuations. Investors may find that cost is trying to break over the red ribbon. This guarantees a rise in Pundi X until it is above the ribbon.
Trading volume (1.083 M) is below the 20-day moving average (2.993 M). The volume is moderate, so slowly move the cost at the pivot point. Investors may also see the volume bar on the chart tilted. This indicates that anomalous instability is common on subsequent trading days.
The RSI indicator gave a signal (bullish) with 53, projecting a purchase signal in the currency. Investors can observe an inclined slope from 31 to 53. It can arise in future trading sessions.
Long-Term Perspective of The Price of The Pundi X Coin
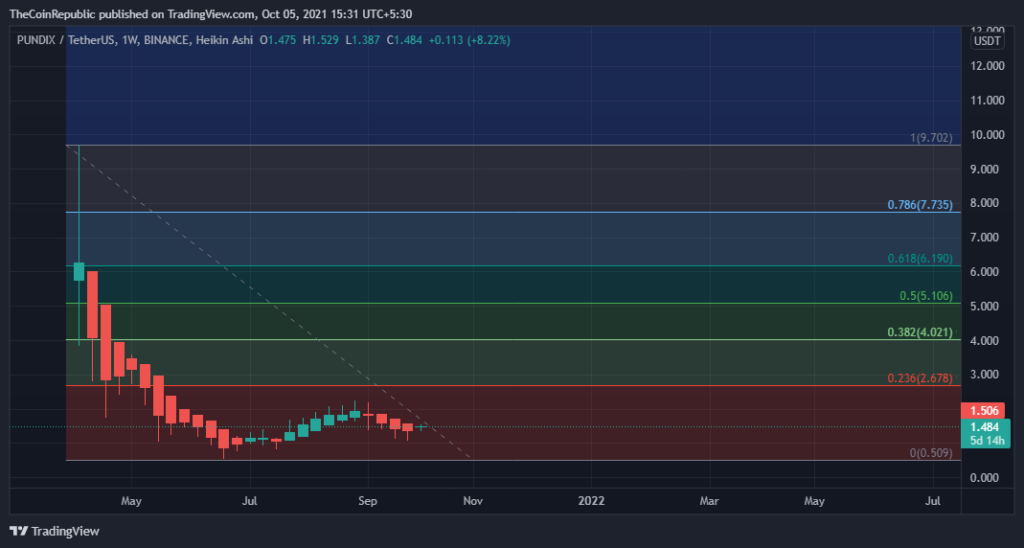
The weekly technical chart and price trend of Pundi X coin show a bearish trend. Based on the Fibonacci retracement levels, the support zone is 0.50 USDT. From another perspective, if it rushes upwards, the resistance level to look for is 4.0 USDT. Moreover, the graph shows the Heiken Ashi candles, representing a substantial downside potential in the assets price action.
So, Today’s price for Pundi X is $1.53, and the 24-hour trading volume is $23,034,779. The price of PUNDIX has risen 4.6% in the last 24 hours. It has a circulation of 260 million PUNDIX coins and a total of 258 million. The RSI points to a buying signal, and the traders have prompted moderate volume. In fact, the cost is trying to break the pivot levels. Similarly, the general outlook for the market is that the pattern will remain bullish over the following trading days.
Resistance Level: $2.0 & $4.0
Support Level: $0.80 & 0.50
.




