
 astronaut
 Zylo Ecosystem
 Pearl
Pearl Bitcoin
 Quantus
 Pudgy Penguins
 Bitway

Bitcoin price traded near $64,428 on July 10, as traders tested resistance after a sharper recovery. The move came as analysts tracked whether buyers could turn a short rebound into continuation.
The setup carried a split signal. Technical traders saw a stronger breakout attempt, while on-chain demand data pointed to weak spot activity.
Bitcoin Price Faces Resistance Test
Michaël van de Poppe said Bitcoin showed more strength after its recent rebound. He said continuation over the next one to two weeks could support a move toward $70,000.
Ted Pillows placed the main resistance zone between $64,000 and $65,000. He said a reclaim could send the asset toward $68,000, while rejection could reopen $62,000.
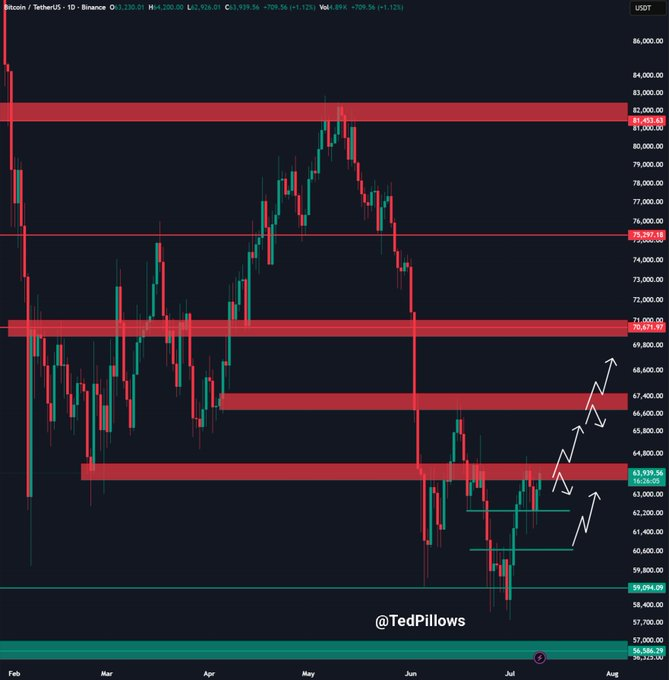
That view matched a cautious short-term structure. Bulls gained momentum, but they still had to prove control above resistance.
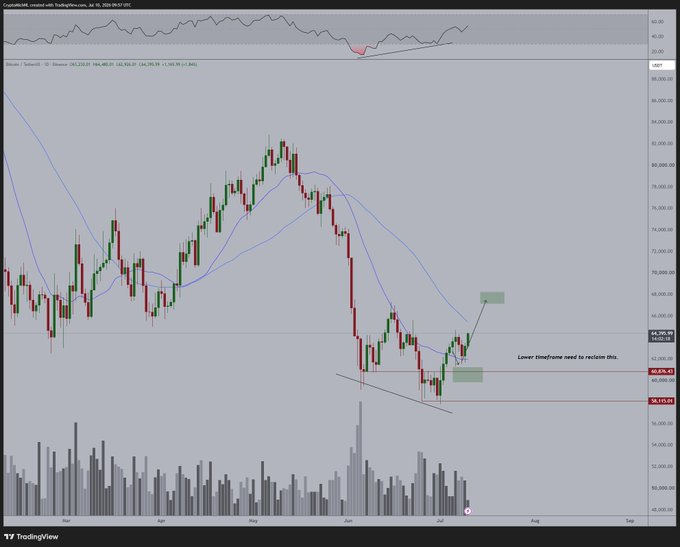
Killa said Bitcoin formed a higher low around $61,500. The analyst said a reclaim of $64,700 could open a path toward $65,500 to $66,000.
The setup also carried a seasonal warning. Killa said July often produced lower highs during bear-market years.
Jelle said Bitcoin pushed back into its previous range after locking in a higher low. The analyst said bulls held a better structure if the asset defended $63,000.
The price reaction showed why traders focused on confirmation rather than movement alone. A rebound can fail when spot buyers do not follow leverage.
Bitcoin Price USD Data Shows Weak Spot Demand
CryptoQuant research from April said Bitcoin spot demand stayed in deep contraction despite institutional purchases. That weakness reduced confidence in a durable recovery.
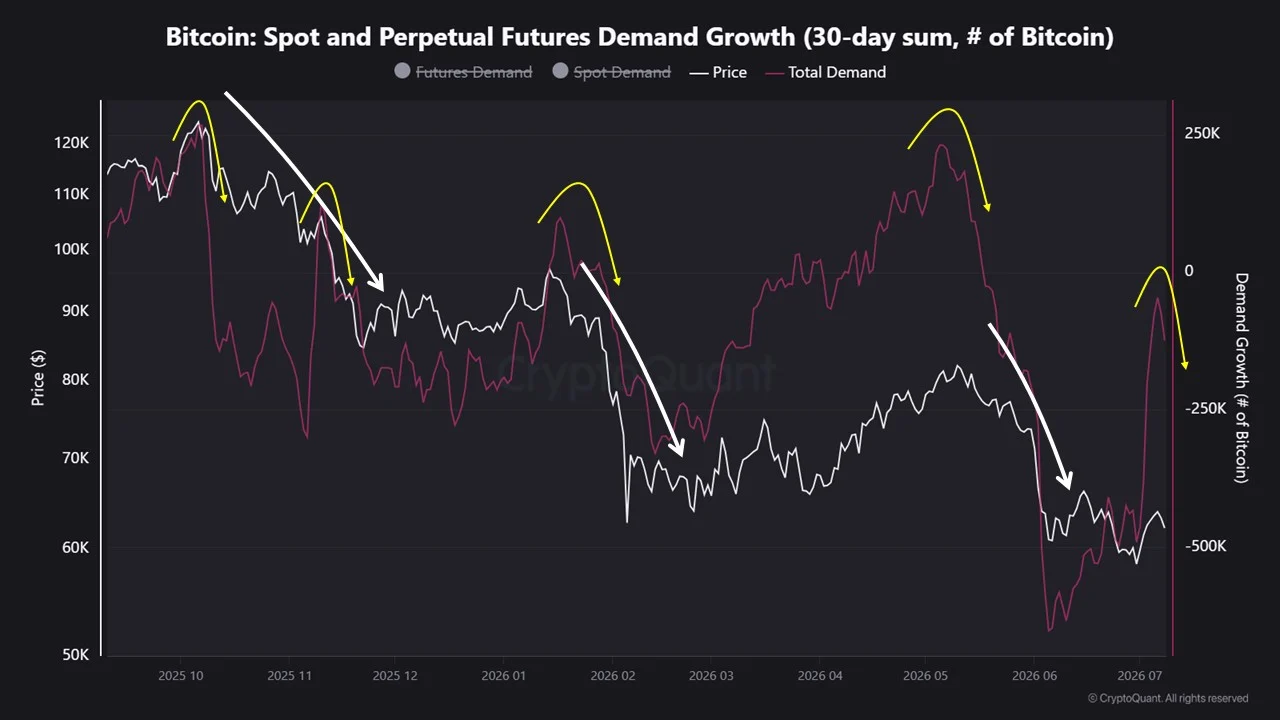
ScenarioX said total Bitcoin demand rebounded from minus 650,000 BTC in June. The analyst said derivatives demand drove much of that improvement.
The same note said total demand reversed lower again to minus 120,000 BTC. It failed to reclaim the zero line, which kept demand conditions negative.
İbrahim COŞAR said Bitcoin’s 90-day Spot Taker Cumulative Volume Delta returned to neutral. He said aggressive spot buying power weakened after earlier support.
CryptoQuant’s public indicator describes that metric as the difference between market buy and sell volume. It tracks spot pressure over a three-month period.
That data weakened the bullish case. Futures-led rebounds can move price quickly, but they often fade without cash-market demand.
KuCoin News cited CryptoQuant data that showed long-term apparent demand reached its weakest level since February 2024. The report said new buying did not absorb available supply.
The demand issue mattered because resistance sat close to recent trading levels. A failed breakout could pressure leveraged longs and force faster downside moves.
Bitcoin Price Structure Splits Bulls And Bears
CW said Bitcoin broke through a major resistance line again. The analyst said the breakout strength looked stronger than earlier attempts.
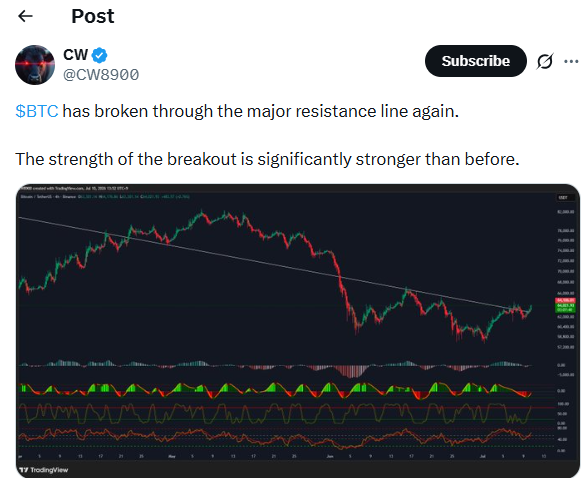
That signal supported the bullish structure. Still, the broader demand setup did not confirm a clean trend reversal.
Whale Factor cited BTC Treasuries data showing public companies bought 110,000 BTC in Q2. The account said corporate treasuries held 1.26 million BTC.
Corporate accumulation added a supply-side support argument. It did not fully offset weaker spot taker demand in the short term.
Wall Street Journal reported that Strategy sold 3,588 Bitcoin last week for about $216 million. The company used the proceeds to fund preferred stock dividends.
That sale complicated the corporate treasury narrative. Large holders can support demand, but balance-sheet needs can also create selling pressure.
Barron’s reported earlier this week that Bitcoin’s recovery paused after reaching a two-week high. The report tied the move to risk caution across broader markets.
That macro backdrop left Bitcoin between two forces. Technical momentum improved, but demand measures did not show strong spot participation.
The next level was clear. A confirmed reclaim of resistance could extend the move, but weak spot buying kept the market exposed to rejection.




