
 Walrus
 Quantus
 Pudgy Penguins
 Bitway
 Quant
Quant Sui
Sui Bitcoin

Ethereum traded near $1,900 after moving within a narrow range during the previous several sessions. The consolidation coincided with four consecutive days of U.S. spot Ethereum ETF inflows, higher futures open interest and Ethereum DeFi TVL near $42 billion. These indicators showed increased market activity but did not independently confirm a price breakout.
Ethereum Price Stalls Despite ETF Accumulation
According to SoSoValue, U.S. spot Ethereum ETFs recorded $72.64 million in net inflows on July 22, extending their positive-flow streak to four consecutive trading sessions.
It was the fourth consecutive day of inflows, bringing the cumulative inflows to over $184 million. These gains mean that the funds have added over $382 million in assets this month. This is a big increase as the funds had over $528 million in outflows in June and $540 million in May this year.
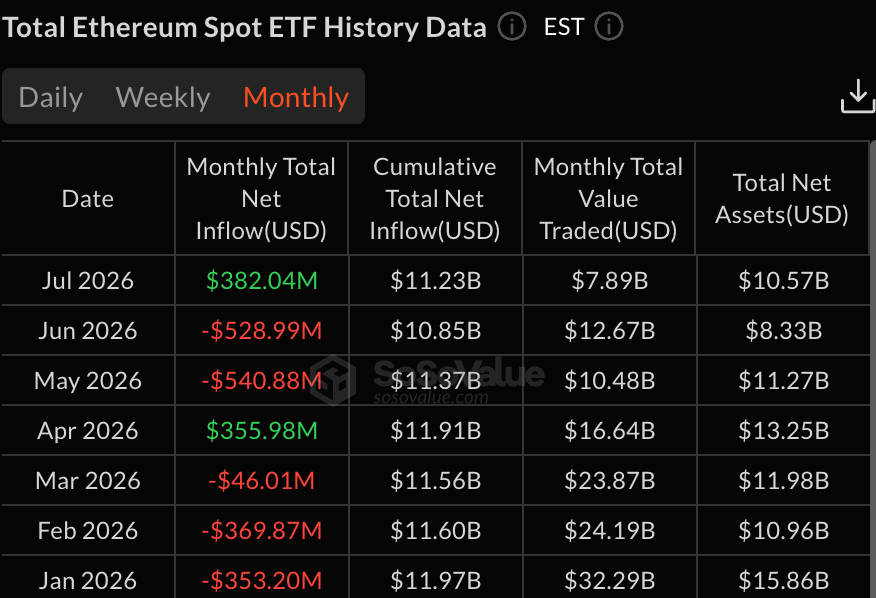
When an asset consolidates while investors are accumulating positions, it often indicates underlying strength and can be a bullish sign, as buyers gradually build exposure before a potential breakout.
BlackRock’s ETHA has led these inflows, with the daily increase hitting $53.4 million. Fidelity’s FETH ETF added close to $20 million in inflows on Thursday. As a result, Ethereum ETFs have accumulated over $11.2 billion in assets, with the current AUM being $10 billion.
More data shows that Ethereum demand is rising gradually. For example, the futures open interest has gained gradually, reaching a high of $27.7 billion today. It has jumped to the highest level since June 4 and has moved from this month’s low of $21 billion.
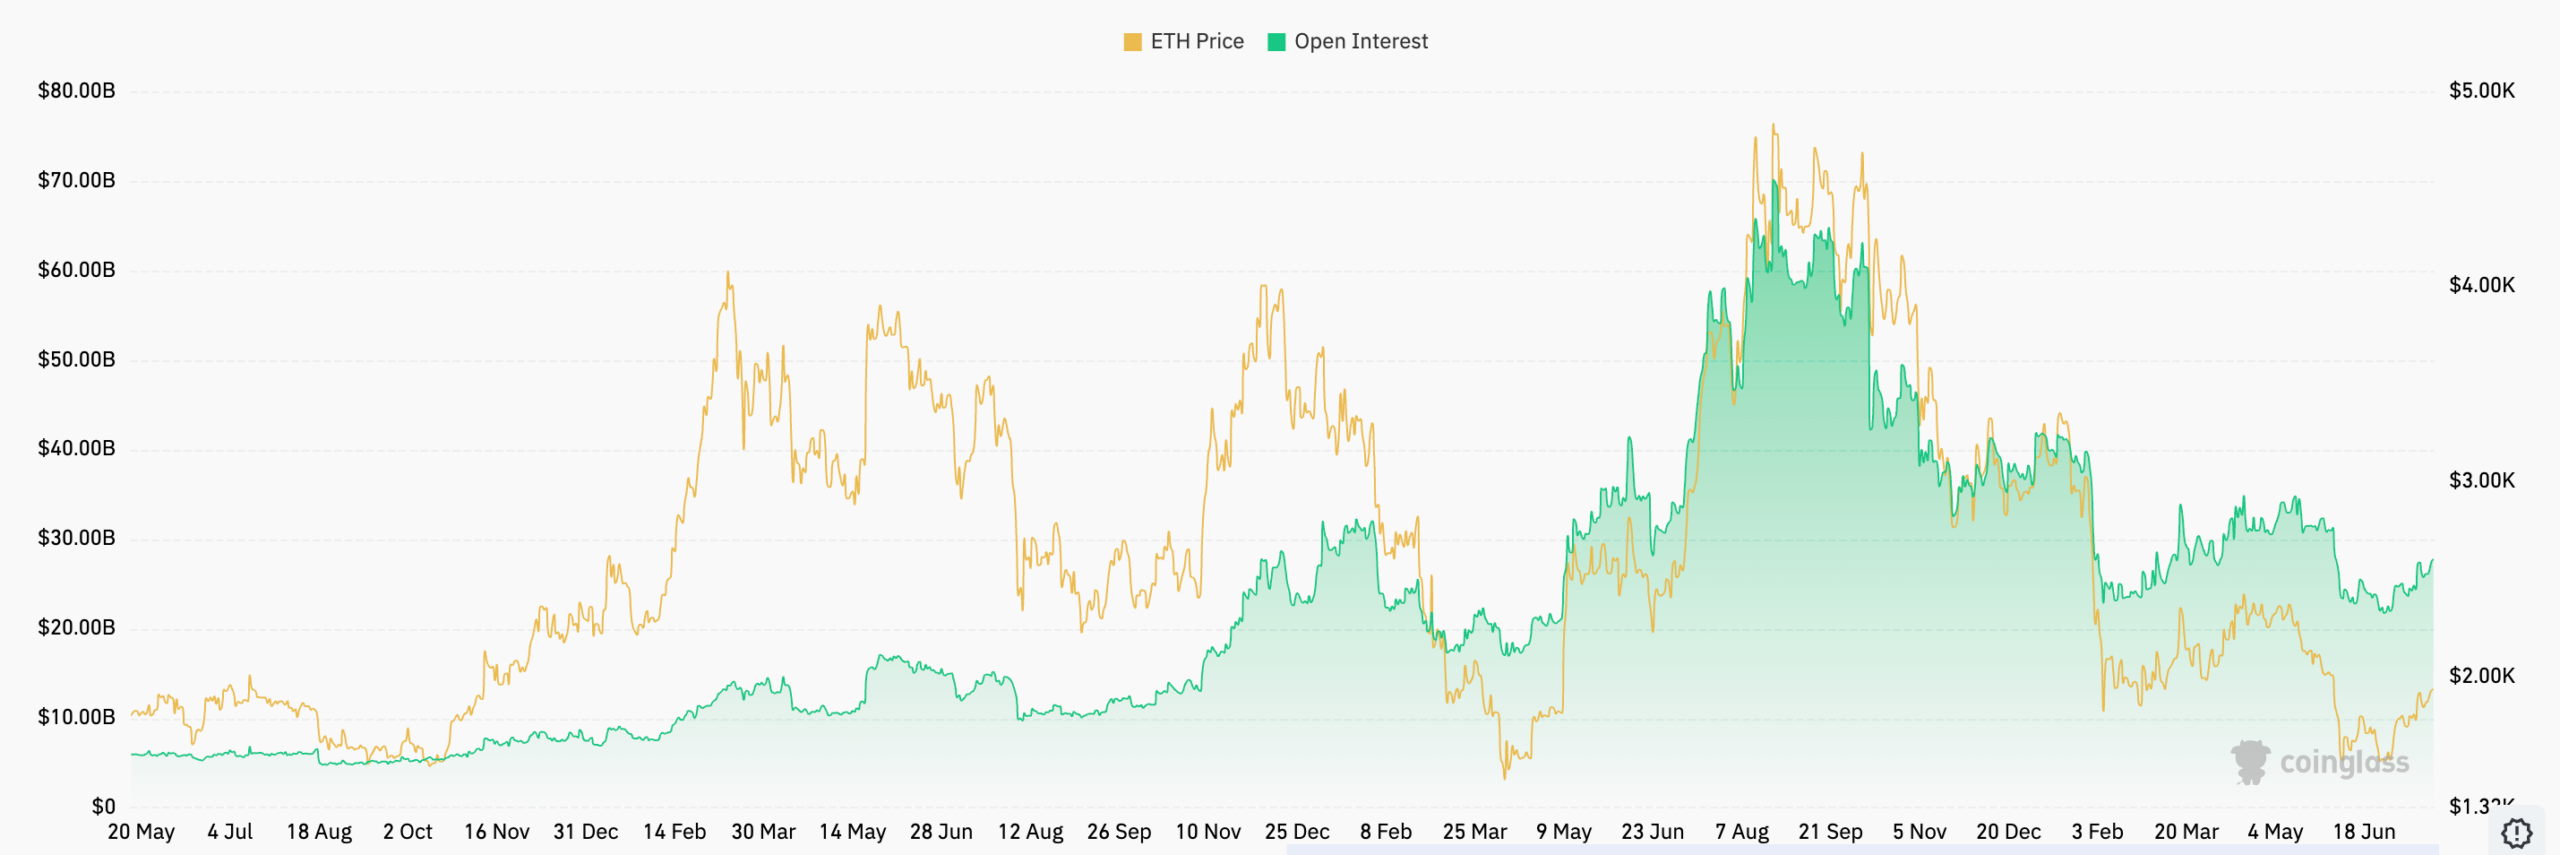
Open interest measures the value of outstanding derivatives positions that have not been closed or settled. Rising open interest indicates greater futures participation, but it does not reveal whether positioning is ultimately bullish or bearish. Positive funding means perpetual-futures longs are paying shorts, reflecting a leveraged long bias rather than confirmed spot demand.
Ethereum Network Growth is Continuing
Meanwhile, third-party data shows that Ethereum’s network is doing well and starting to gain traction. One of the closely-watched metrics is the total value locked (TVL) in the network, which has jumped to $41 billion from this month’s low of $37 billion. Top protocols in the network have seen an increase in assets. For example, Lido’s assets have jumped by 15%, while Aave and Binance Staked ETH have jumped by 13% and 11.6%, respectively.
More data shows that the number of active transactions has done well in the past few months. Ethereum handled over 203 million transactions in the second quarter, a record high. Its transactions this quarter so far stand at 55 million. Soaring transactions are a sign that Ethereum’s utility is growing.
On the other hand, however, some key metrics have retreated in the past few days. Stablecoin supply has dropped to $151 billion from the year-to-date high of $168 billion. Also, the DEV volume in the chain has continued moving downwards.
ETH Price Technical Analysis
Ethereum price has crawled back in the past few weeks. This rebound happened after it formed a double-bottom pattern at $1,509 and a neckline at $1,840, its highest level on June 15.
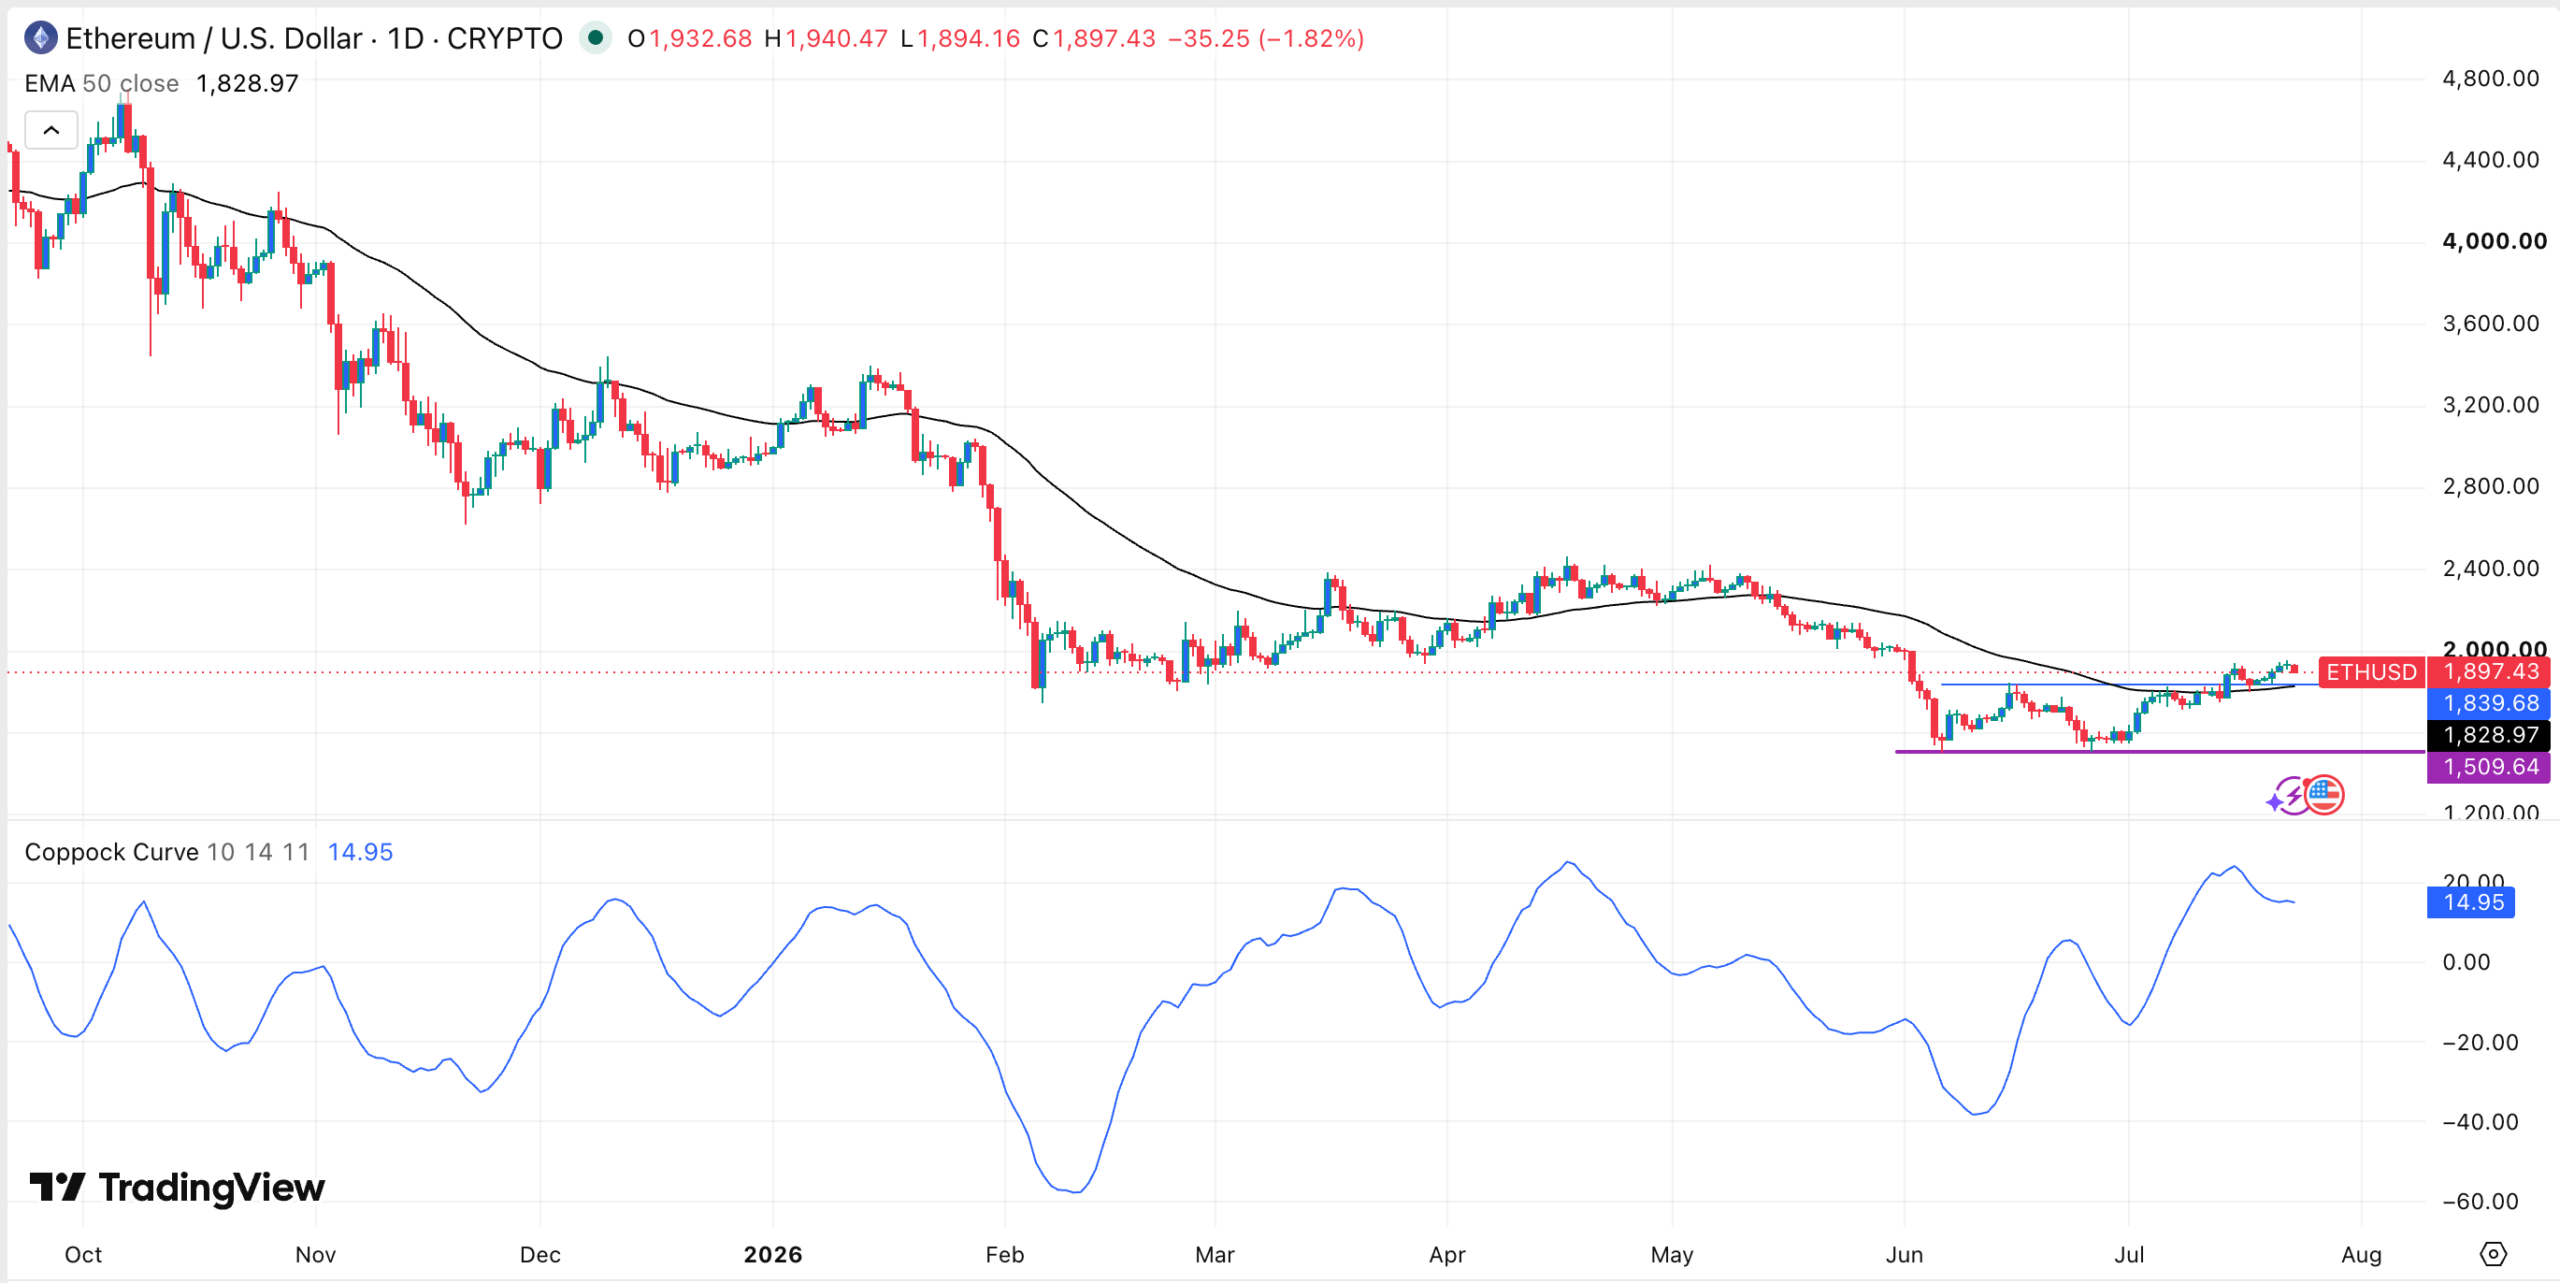
The token has already crossed the 25-day Exponential Moving Average (EMA), a sign that bulls are prevailing. Additionally, the Cappock Curve indicator has continued to rise to 14.95. It has jumped from a low of minus 37 in June.
Therefore, the coin will likely continue rising as bulls target the next important resistance level of $2,000. A surge above that level will point to more upside, potentially to $2,500.
This article is for informational purposes only and does not constitute financial or investment advice. ETF flows, futures open interest, DeFi TVL, transaction data and technical indicators do not guarantee future Ethereum price performance. Cryptocurrency markets remain highly volatile, and readers should conduct their own research before making investment decisions.



