
 Zylo Ecosystem
 Walrus
 Bitcoin
 Sui
Sui Quantus
 Quant
Quant Starknet

Hedera is sitting near a long-term decision area after losing most of its value from the 2024 peak. At press time, the HBAR price traded around $0.0659. On the other hand, the weekly structure still reflects lower highs and persistent selling pressure.
Yet a weekly chart shared by CryptoPatel places HBAR above a historical demand zone between $0.0435 and $0.057. Derivatives data also shows positive funding, suggesting traders still hold a modest long bias despite the wider downtrend.
Hedera Historic Demand Zone Returns to Focus
CryptoPatel’s weekly HBAR/USDT chart identified a broad demand zone between approximately $0.0435 and $0.057. The region has previously acted as a base during major market-cycle transitions.
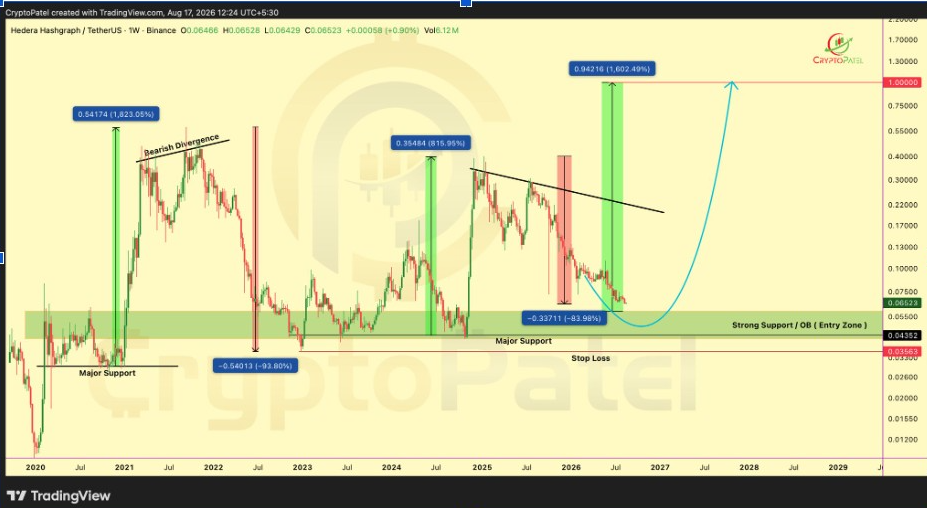
HBAR price currently trades above this area after falling roughly 84% from its 2024 high. The decline has returned prices toward levels where buyers previously entered aggressively.
The chart highlighted $0.04352 as major long-term support. A lower boundary near $0.03563 serves as the invalidation level for the bullish setup. A weekly close below $0.03563 would weaken the historical support thesis. Until then, the wider demand region remains technically active.
Previous reactions from similar areas produced sizable expansions. The chart marks one historical advance near 1,823% and another around 816%.
Weekly Structure Still Favors Patience
HBAR crypto has not yet broken its broader bearish market structure. The weekly chart shows a descending resistance line connecting lower highs formed after the 2024 advance.
Price remains beneath that trendline, keeping sellers in control of the larger timeframe. A support reaction alone would therefore not confirm a sustained reversal.
CryptoPatel outlines several technical events that could strengthen the bullish case. The sequence begins with a liquidity sweep around the demand zone.
HBAR price would then need to reclaim lost levels and establish a change of character. A subsequent break of structure would provide stronger confirmation that buyers control momentum.
This setup allows for another decline before a meaningful recovery develops. Price may find support at $0.0435 to $0.057 before making a wider reversal.
Long-Term Targets Depend on Trend Reversal
If HBAR breaks its downward trend, several potential targets can be seen on the weekly chart. The projected levels include $0.10, $0.30, $0.50, $0.70, and $1.
The $0.10 area represents the first major psychological target. Reclaiming that level would also place Hedera‘s price further above the current long-term accumulation region.
Higher targets become increasingly dependent on stronger market conditions and sustained weekly momentum. The $1 target represents the most aggressive scenario shown on the chart.
CryptoPatel maps at approximately 1602% of the lower base region. The projection broadly reflects the scale of expansions recorded during earlier HBAR cycles.
Still, the bullish roadmap depends on the demand zone holding. The descending weekly resistance also needs to break before higher targets gain stronger technical support.
HBAR Price and Derivatives Signal Caution
HBAR trades near $0.0659, up around 1.31% on the daily chart. Its market capitalization sits near $2.9 billion. Intraday action shows buyers recovering from an earlier decline. Price bounced sharply from the session low before moving into the upper $0.06 range.
Immediate support sits near $0.060, followed by $0.057. Losing that level could expose the wider $0.0435 demand area.
Resistance first appears around $0.070, followed by approximately $0.075 and $0.080. Those areas previously attracted selling pressure during recent rebounds. Derivatives data adds a mildly constructive signal. Coinglass shows HBAR’s OI-weighted funding rate near 0.0044% on August 17.
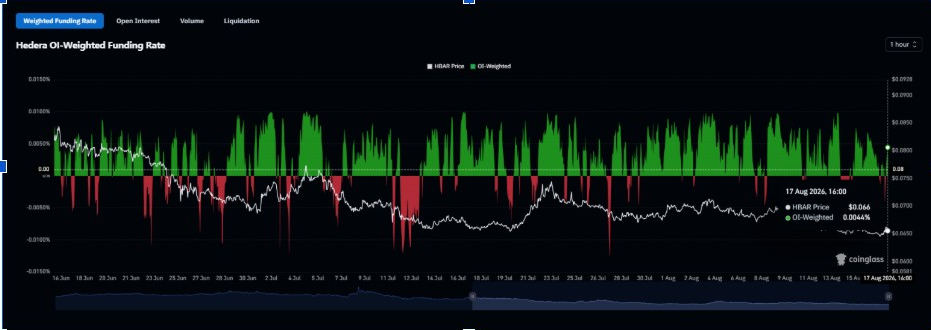
Positive funding indicates long traders are paying shorts, reflecting a modest bullish positioning bias. The reading remains below previous spikes near 0.01%.
That suggests leverage is not yet unusually stretched. Still, positive funding during weak price action could increase liquidation pressure during another downside move.



