Injective
 Celestia
 streamoors
 Sui
Sui Pudgy Penguins
 Bitcoin
 Pearl
Pearl
- The DCR token price continues to fall while the EMAs maintain a bearish formation.
- The DCR/BTC pair trades at 0.001868 BTC with a fall of 3.33%.
- The 24 -hours volume of the token is $15 Million, indicating a 66% rise.
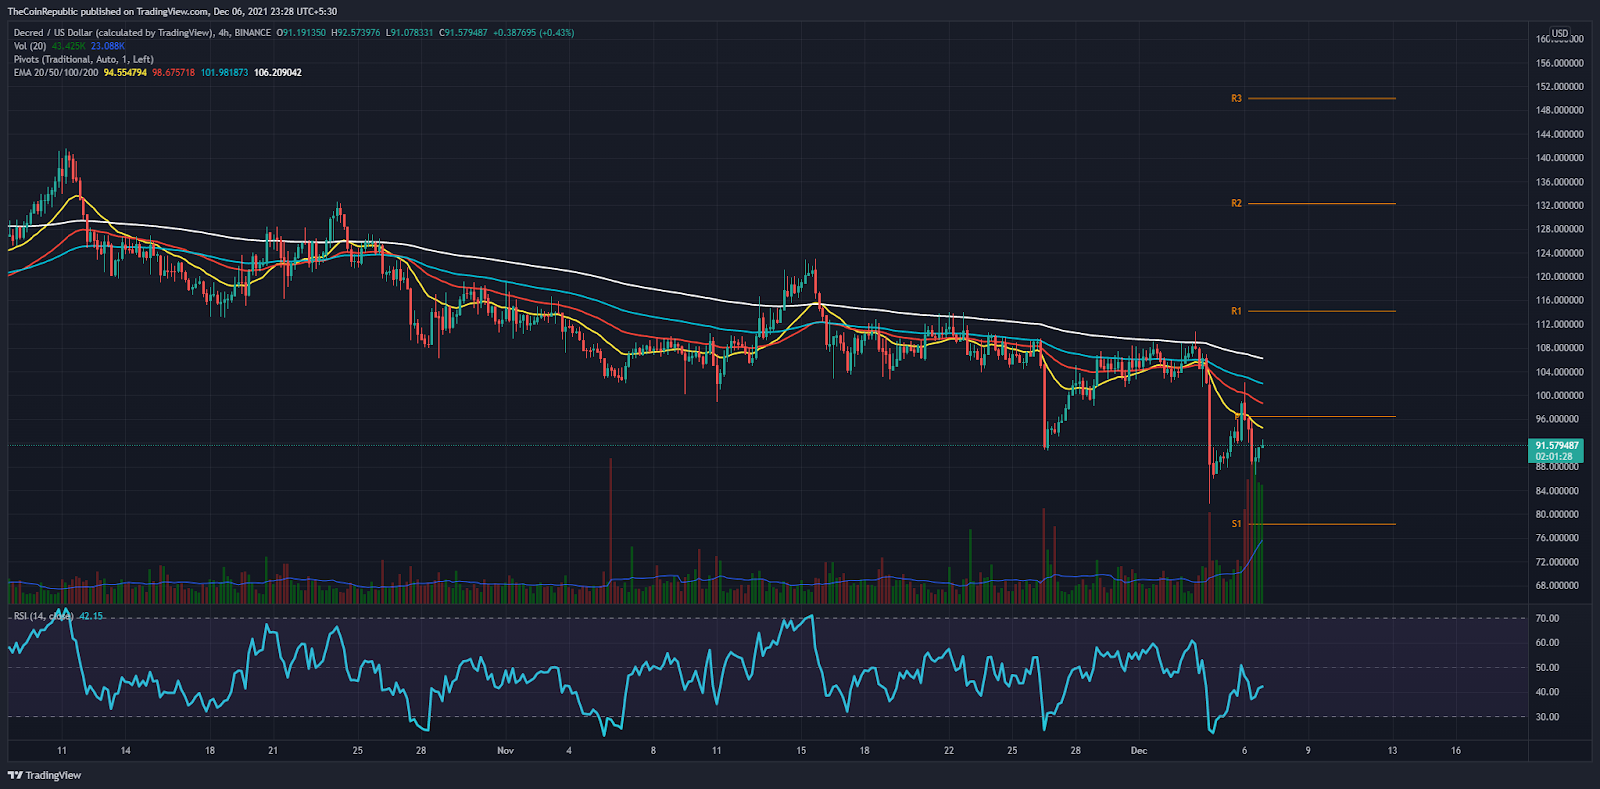
The DCR token price continues to move under the bearish influence in the daily chart. Moreover, the price manages to breach below the $95 mark. Hence, traders can shortly find bearish entry opportunities.
Additionally, the EMAs keep an alignment that is bearish, which undermines the hope for a bullish reversal. Moreover, the 20-day EMA provides constant resistance for any bullish attempt.
Furthermore, the price of the DCR tokens has shown a bearish trend and the pivot point suggests support levels around the $78 and $60 mark if the price exhibits downward pressure. Additionally, on the reverse side, the resistance line is located at $96 as well as at the $115 mark.
At the time of writing this analysis, it is around $91.50, with an intraday fall of 4.02%. Moreover, the 24-hours volume of the token is $15 Million, indicating a 66% rise.
Will The DCR Token Price Fail To Give A Bullish Reversal?
As we’ve already discussed, it appears that the DCR token has very low chances of a bullish reversal and the price action shows multiple candles with higher price rejection. Therefore, it is evident that the bears are not losing control of the trend. Hence, traders will be able to identify selling opportunities at current prices.
The RSI indicator is a sign of an increase in the bearishness of the underlying as the slope is entering the nearly oversold zone, below the 50% mark.
Furthermore, the MACD, as well as the signal line of the Moving Average convergence divergence indicators, are both moving lower than the neutral zone (0.00) which indicates that the token is experiencing bearish momentum.
Conclusion: From a technical perspective, the DCR token indicates increased trend momentum. However, the huge lower price rejection in the daily chart increases the chances for a bullish reversal. However, investors looking out for a selling opportunity need to wait till the price closes below the $85 mark.
Support – $78 and $60
Resistance – $96 and $115
DISCLAIMER: The views and opinions stated by the author, or any people named in this article, are for informational ideas only, and they do not establish the financial, investment, or other advice. Investing in or trading crypto assets comes with a risk of financial loss.