
 astronaut
 Walrus
 Pearl
Pearl Bitcoin
 NEAR Protocol
 Zcash
Zcash Hyperliquid

Bitcoin price traded near $77,000 on Sept. 11 as exchange balances and ETF flows pointed to softer short-term demand. Binance’s Bitcoin reserves climbed above 693,000 BTC, their highest level in two years, while U.S. spot Bitcoin ETFs recorded a third consecutive session of net withdrawals. BTC is also trading near an important weekly moving-average region after failing to hold its recent rebound above $80,000.
The combination does not confirm another major Bitcoin downturn, but it increases the importance of support around current levels. Rising exchange reserves can increase readily available sell-side liquidity, while persistent ETF redemptions reduce one source of institutional demand. Technical traders are now watching whether Bitcoin can stabilize around its weekly trend indicators or extend the pullback toward lower support.
Binance Bitcoin Reserves Climb Above 693,000 BTC
Binance now holds more than 693,000 BTC, according to CryptoQuant data shared by Darkfost. That amount represents about 30% of Bitcoin reserves held across major exchanges. Binance reserves have increased by roughly 77,000 BTC since late April. The rise follows Bitcoin rallies in May and again in recent weeks.
The increase places more Bitcoin on the exchange while BTC crypto trades near $77,000, down over 4% in the last week. Investors often move coins to exchanges before selling, although transfers can serve other purposes. Darkfost also linked part of the increase to Binance’s SAFU fund plan. The fund plans to deploy $1 billion and acquire about 15,000 BTC.
Some holders also moved Bitcoin to exchanges after the ColdCard incident. Those transfers may reflect custody decisions rather than immediate selling. Even so, the reserve increase expands the amount of BTC available on Binance. Exchange balances now sit near levels last seen in 2024.
Bitcoin ETF Outflows Extend to Three Sessions
U.S. spot Bitcoin ETFs recorded $283 million in net outflows on September 10. The latest session marked the third consecutive trading day of withdrawals. ARK Invest and 21Shares’ ARKB posted the largest outflow at about $164 million. Morgan Stanley’s MSBT recorded roughly $4 million in net inflows.
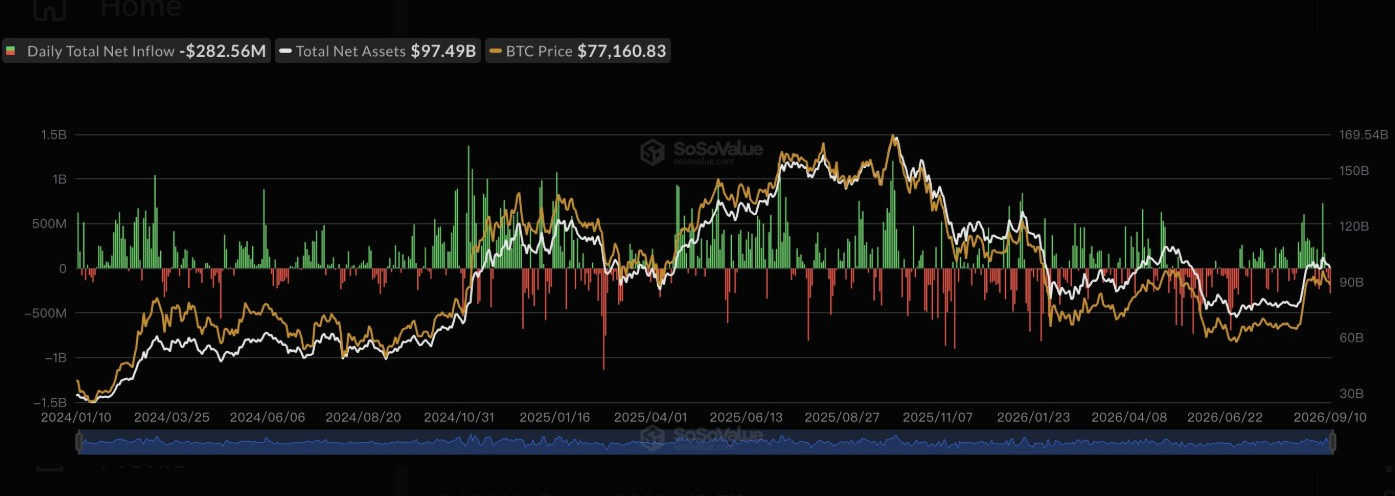
Total assets across U.S. spot Bitcoin ETFs stood at $97.49 billion after the session. That figure represented about 6.28% of Bitcoin’s market capitalization. Cumulative net inflows since launch reached $55.17 billion. Recent withdrawals, however, show weaker demand through regulated spot products this week.
Ethereum spot ETFs also recorded net outflows during the same session. Their combined withdrawals reached $29.76 million. BlackRock’s ETHB led individual inflows with $13.95 million. Broader ETF data add another demand measure as Bitcoin trades below its recent local high.
Bitcoin Tests 50-Week EMA Near $77,400
Bitcoin price traded around $77,000 after falling from levels near $80,000 earlier this week. The weekly chart places the 50-week EMA near $77,408. BTC now trades close to that level after a sharp rebound from the August low. The 50-week simple moving average sits higher, near $79,672.
A weekly close below the 50-week EMA could expose the $72,000 area. That range also sits above the chart’s bull market support band. The band currently spans roughly $70,141 to $71,794. Bitcoin must first hold the weekly EMA to avoid moving closer to those lower support levels.
Bitcoin price action also follows a new golden cross on the daily chart. Bitcoin price rallied from about $62,000 to $82,000 before the crossover formed. BTC crypto then slipped back toward $77,000. Similar setups in 2021, 2023, 2024, and 2025 also saw pullbacks after the signal appeared.
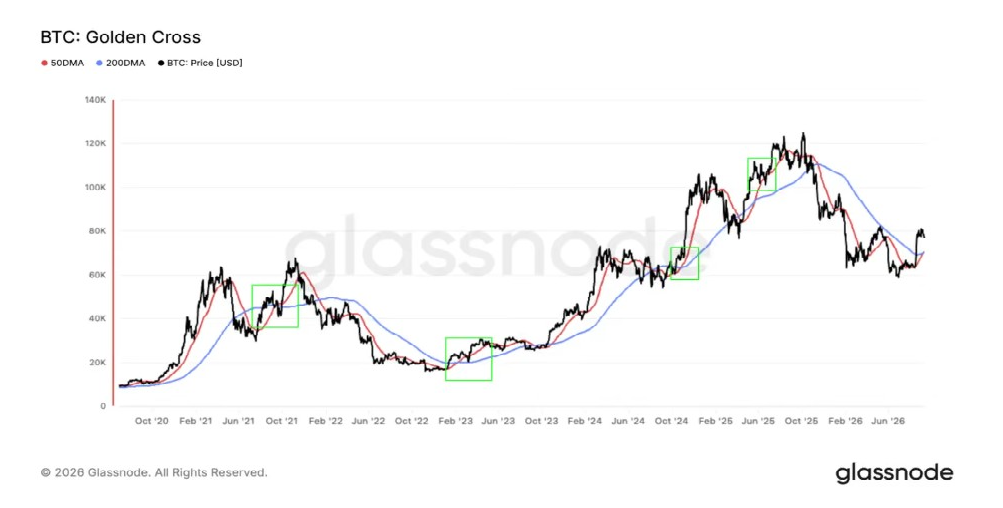
A golden cross forms when the 50-day moving average rises above the 200-day moving average. Traders often track the pattern as a longer-term trend signal. However, Bitcoin price has frequently posted much of its rally before the crossover itself. The latest move follows that pattern so far.
This article is for informational purposes only and should not be considered financial or investment advice. Cryptocurrency markets remain highly volatile. Readers should conduct independent research before making investment decisions.



