
 Dacity Coin
 Pearl
Pearl Bitcoin
 Sui
Sui Quantus
 Injective
 Zcash
Zcash
- Loopring price has been trading below the rising wedge pattern over the daily price chart.
- LRC crypto has fallen below 20, 50, 100 and 200-days Daily Moving Average.
- The pair of LRC/BTC is at 0.00001634 BTC with an intraday drop of 0.58%.
Over the daily price chart, the loopring price is returning from the rising wedge pattern’s top trendline in a negative direction. To advance into its recovery phase, the token must sustain the rising wedge pattern. The rising pattern requires the token to keep moving during its recovery phase. However, the token that short-sellers are holding is what the bears are trying to take. For the LRC cryptocurrency to trade inside the rising wedge pattern, more buyers are needed. Investors in LRC must wait till the daily price chart of the cryptocurrency starts to increase.
The price of Loopring, which is currently priced at $0.32, has fallen below 2.05% of its market value on the most recent day. During intraday trading, the LRC currency’s trading volume fell by 10.99%. This shows that those who are against the LRC currency are attempting to drive the token lower. Volume to market cap ratio is 0.1324.
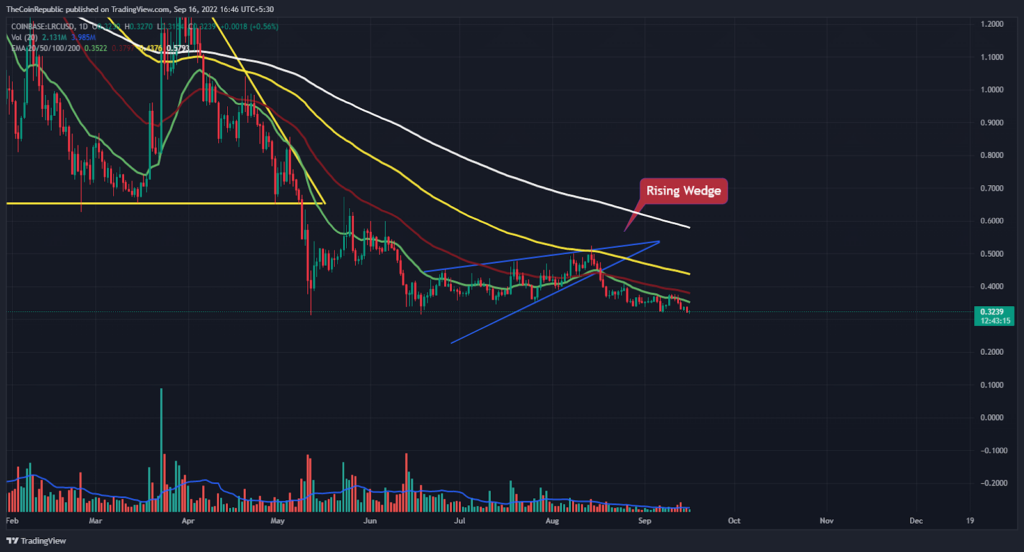
The price of the LRC coin is currently looking for support from buyers after falling beneath the distribution level of the consolidation phase inside the rising wedge. The coin needs assistance from buyers in order to reverse the upward momentum and return to the higher level before the rising wedge formation. It can be seen that the volume change was below average and bear-influenced. LRC bulls need to build up for the token to begin its comeback phase.
What do Technical Indicators suggest about LRC?
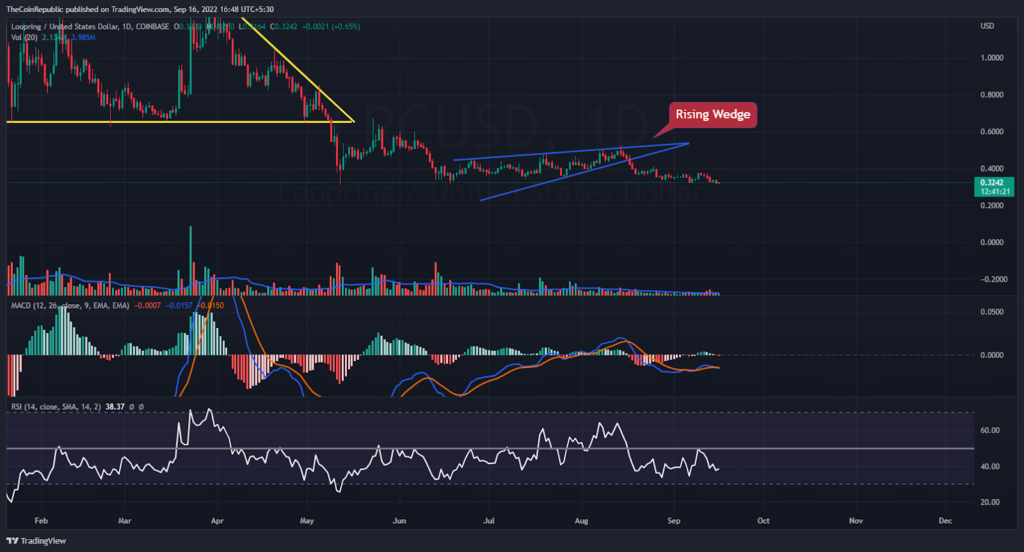
The bottom trendline of the rising wedge formation must be broken for the price of the LRC cryptocurrency to rise. The coin still has to attract a substantial number of buyers if it wants to beat the daily chart. Technical indicators show the extent of the LRC currency’s decline.
The relative strength index (RSI) displays the pace of depreciation of the LRC coin. At 38, the RSI is moving in the direction of neutrality. The LRC coin’s falling velocity is displayed by the MACD. Even when it is above the signal line, the MACD line has a hard time catching up. Investors in LRC should monitor the daily chart for any shifts in trend.
Conclusion
Over the daily price chart, the loopring price is returning from the rising wedge pattern’s top trendline in a negative direction. To advance into its recovery phase, the token must sustain the rising wedge pattern. The rising pattern requires the token to keep moving during its recovery phase. However, the token that short-sellers are holding is what the bears are trying to take. For the LRC cryptocurrency to trade inside the rising wedge pattern, more buyers are needed. It can be seen that the volume change was below average and bear-influenced. LRC bulls need to build up for the token to begin its comeback phase. Technical indicators show the extent of the LRC currency’s decline. Investors in LRC should monitor the daily chart for any shifts in trend.
Technical levels
Support Levels: $0.30 and $0.29
Resistance Levels: $0.35 and $0.38
Disclaimer
The views and opinions stated by the author, or any people named in this article, are for informational ideas only, and they do not establish the financial, investment, or other advice. Investing in or trading crypto assets comes with a risk of financial loss.




