
 streamoors
 Celestia
 Injective
 Pudgy Penguins
 NEAR Protocol
 Pearl
Pearl Starknet
- Hershey Co. stock price is currently at $247.76 with a decline of 0.9% in 24 hours.
- Hershey Co. (HSY)’s live market cap is $50.64 Billion.
Since May 2023, the stock price of Hershey experienced a rapid decline of 11% in just 2 months as the bears entered the market. The stock is trading close to a significant level of resistance at $243, indicating the possibility of further decline.
Hershey (HSY) stock has suffered significantly as a result of the current price decline as it has begun trading below the 20-day Exponential Moving Average (EMA) and buying volume has been declining. These variables point to the possibility of the downward trend’s continuance in the days to come.
By evaluating the fundamentals of the company, it can be identified that $2.7 Billion in short-term assets do not cover its $3.3 Billion in short-term liabilities. Also, its $4.4 Billion in long-term liabilities are not covered by its short-term assets.
Hershey’s Price/Earnings (P/E) ratio is 29.8x, greater than the 20–25x industry standard. This suggests that, about its profit potential, the stock may be thought of as being a little expensive.
Additionally, Hershey’s current net profit margins of 15.8% are lower than the margin of 17.3% from the prior year. This implies that the company’s profits have not increased beyond that of the previous year.
Hershey’s debt is rising, as shown by the supplied chart, which has a debt/equity ratio of 133.8%. This high ratio shows that the company has more debt than total equity, which is often regarded as a bad indicator.
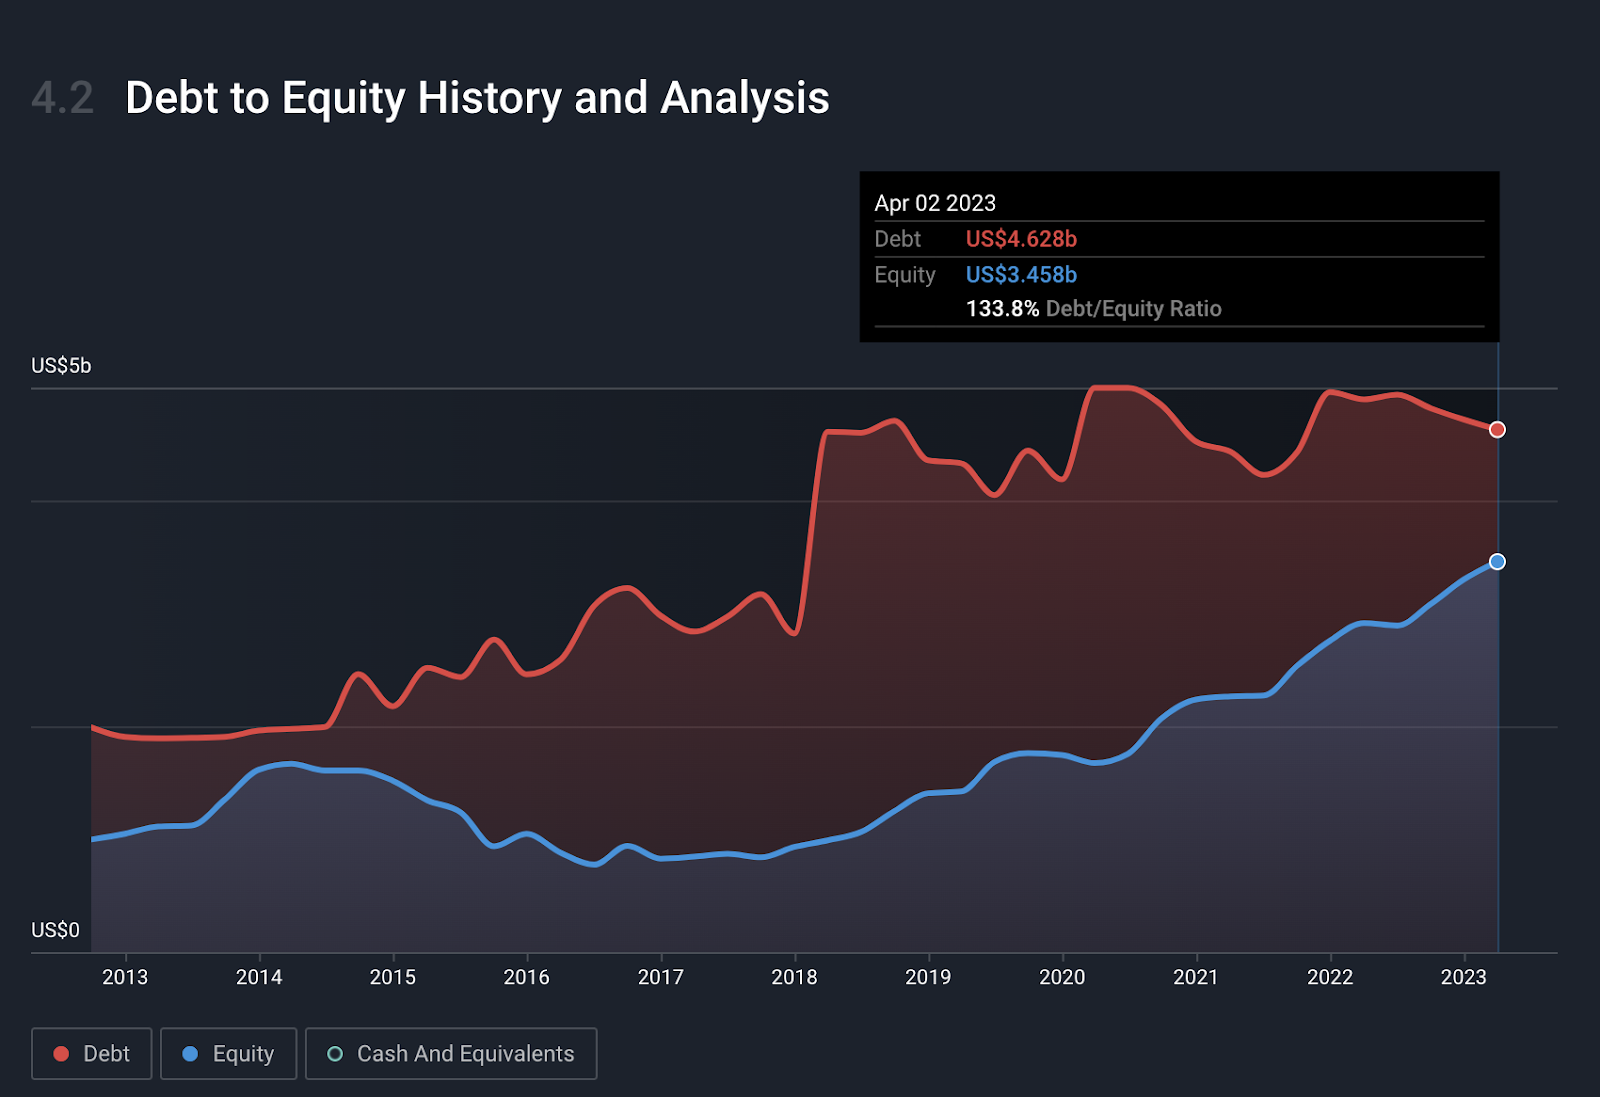
Hershey Co. (HSY) Stock Price Analysis
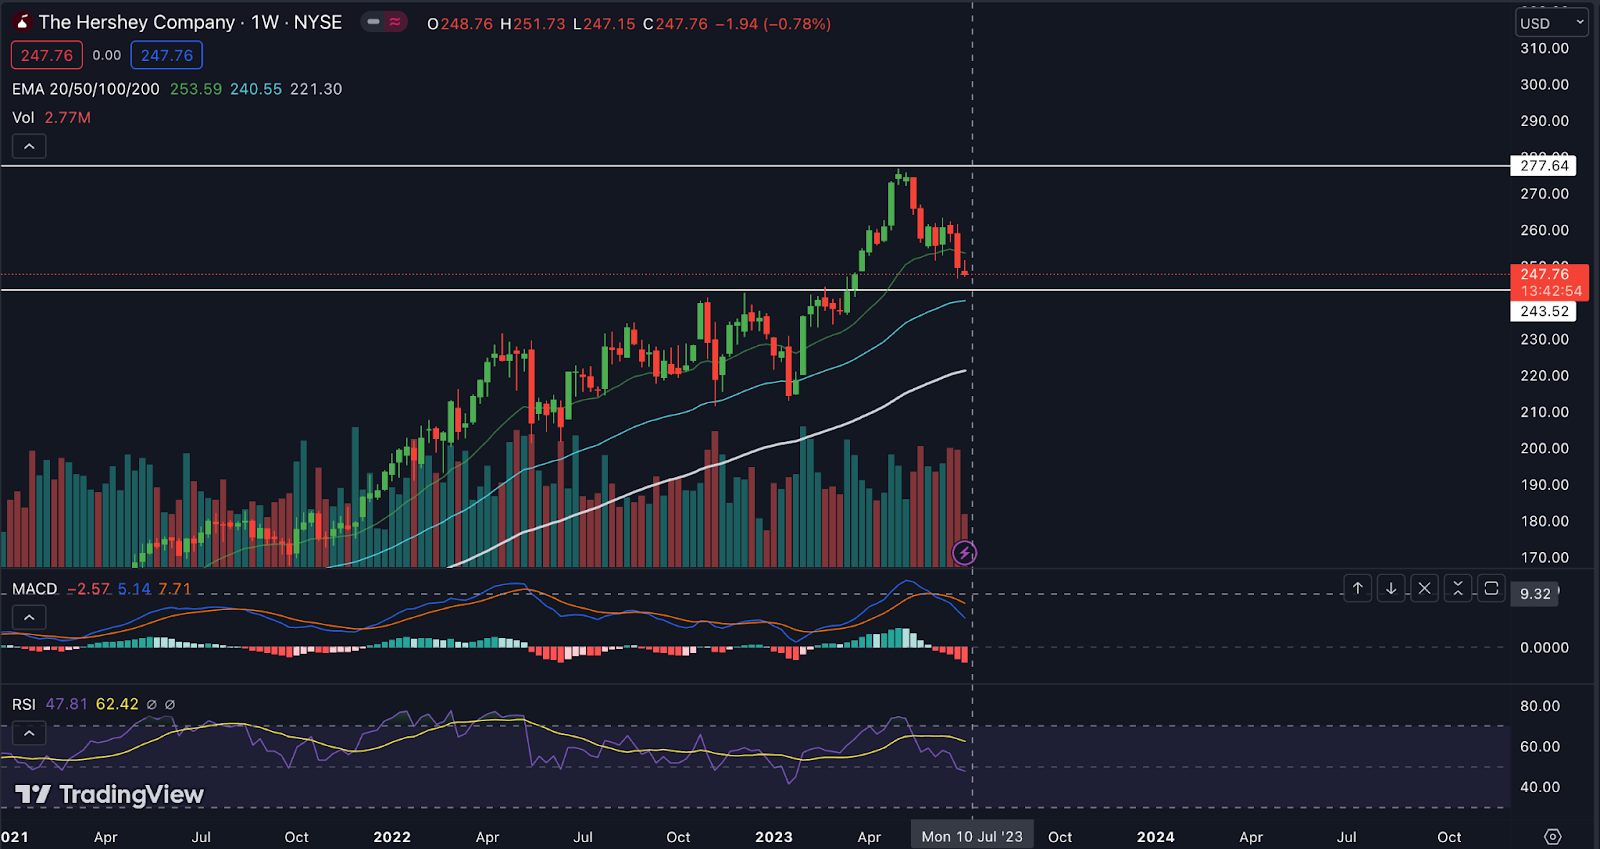
In the weekly time frame, Hershey’s price is below the 20-day EMA level showing weakness in price in the upcoming days.
By looking at the MACD indicator, we can observe that the MACD line is trading below the signal line which indicates that Hershey stock price is weak.
The RSI line is also below the SMA line and it has reversed from the oversold region which means that the price of HSY is negative.
Conclusion
In conclusion, by looking at the chart of Hershey in a weekly timeframe we can say that the price gaining some bearishness. Also, indicators are favoring this movement and showing a negative movement. The fundamentals of the company are showing lots of debt and over P/E ratio which could lead to possible downward movement.
Technical Levels:
- Support – The current support level of Hershey Co. (HSY) is $243.
- Resistance -The current resistance level of Hershey Co.(HSY) is $277.
Disclaimer
The views and opinions of the author, or anyone named in this article, are for informational purposes only. They do not offer financial, investment, or other advice. Investing or trading crypto assets involves the risk of financial loss.



