
 Dacity Coin
 NEAR Protocol
 Quantus
 Bitcoin
 Celestia
 Pearl
Pearl Pudgy Penguins
- Realty Income Corp.’s stock price is currently at $59.90.
- Realty Income Corp. (O)’s live market cap is $40.43 Billion.
Since August 2022, the stock price of Realty Income Corp. fell by 30% in just 25 days. It was a massive fall faced by the stock. The stock managed to take support at the level of $55 and gave a rebound to $68. There it faced resistance and the price again started to move downward. This movement of price formed a descending triangle pattern and it is a bearish pattern.
Hence, the price is likely to continue the downward momentum and it will fall further because of the formation of the current pattern. From the beginning of this year, the stock of Realty Income Corp. (O) faces a decline of 15% indicating a downward trend.
By evaluating the fundamentals of the company, it can be identified that Realty Income Corp.’s Price/Earnings (P/E) ratio is 45.1x, whereas the peer average P/E ratio is 42x which denotes that Realty stock price is slightly costly.
Insiders of the firm recently sold shares, which is a big development. Insiders’ selling of shares valued at $1.7 Million shows that some shareholders have decided to sell their interests. Similar to the independent director, who sold $476k worth of shares, the general feeling is one of selling.
Realty Income Corp. (O) Stock Price Analysis
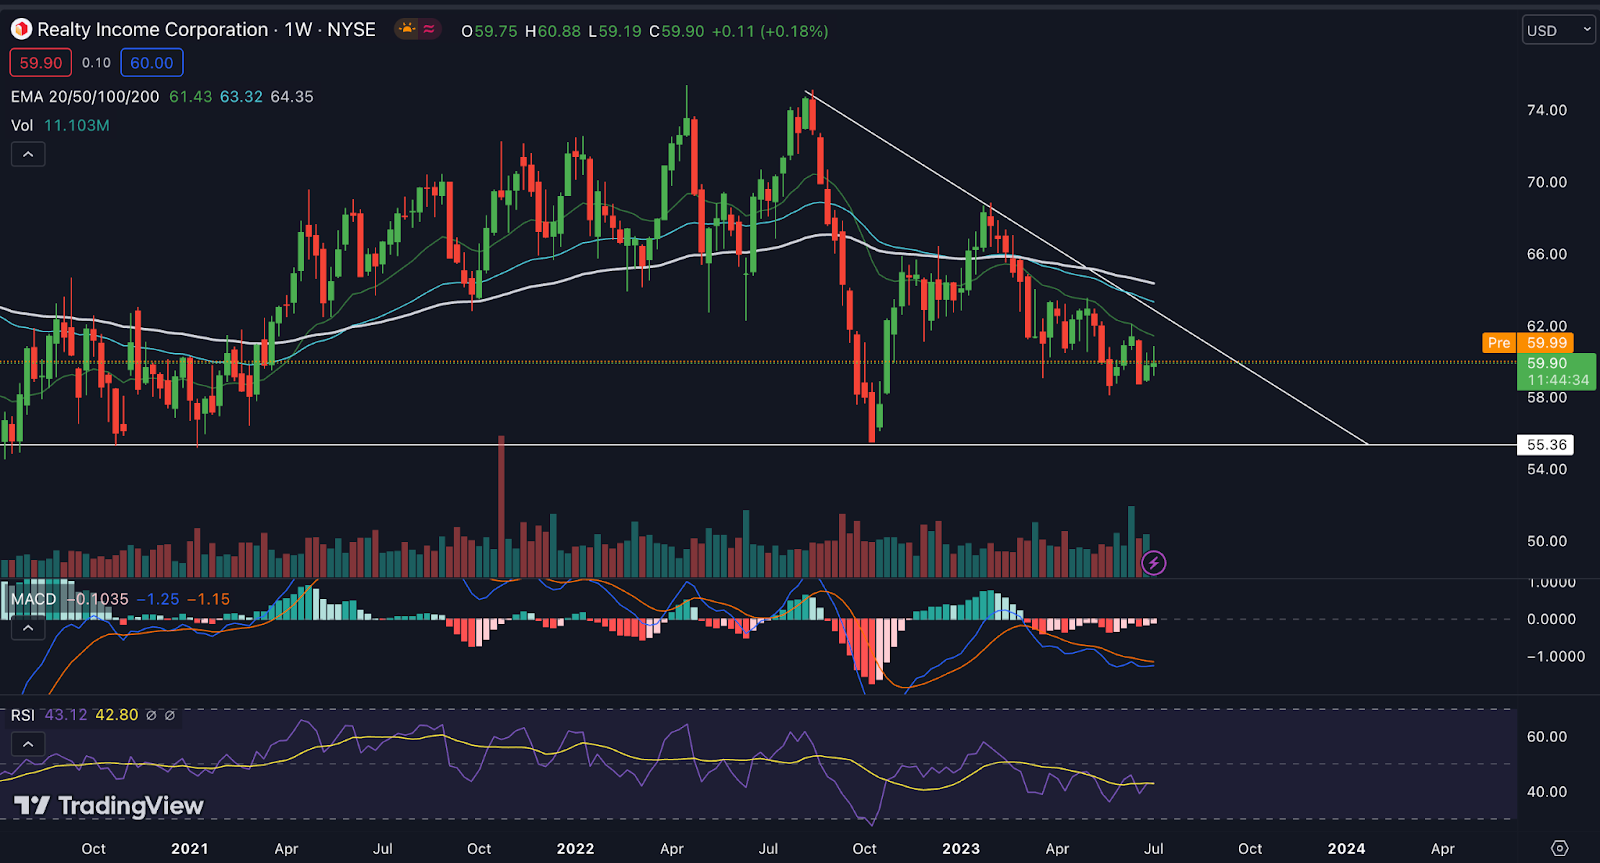
In the weekly time frame, Realty Income Corp. stock price is trading below the 20, 50, and 200-day EMA levels, which is a negative sign for the stock and the price might fall in the future.
By looking at the MACD indicator, we can observe red histogram build up and also the MACD line is placed below the signal line and both are below the zero line which is a negative sign.
The RSI line and SMA line both are placed near the 40 region and the RSI line is placed below the SMA line which indicates a further fall.
Conclusion
It is visible from studying Realty Income Corp.’s weekly chart that the stock is now in a downtrend. Indicators like RSI and MACD are displaying negative movement, indicating that the bearish trend may continue. The company’s fundamentals also point to the potential of additional price declines. When making financial decisions with Realty Income Corp., it is crucial to take these variables into account and to proceed with care.
Technical Levels:
- Support – The current support level of Realty Income Corp. (O) is $60.
- Resistance -The current resistance level of Realty Income Corp. (O) is $55.
Disclaimer
The views and opinions of the author, or anyone named in this article, are for informational purposes only. They do not offer financial, investment, or other advice. Investing or trading crypto assets involves the risk of financial loss.



