
 Dacity Coin
 Celestia
 Pudgy Penguins
 Injective
 Solana
 Sui
Sui Starknet
- Prologis Inc.’s stock price is currently at $122.99.
- Prologis Inc. (PLD)’s live market cap is $115.5 Billion.
The price of Prologis Inc. (PLD) stock price has been moving downward steadily from April 2022. The price began to decrease sharply after hitting a peak of $173, dropping by 43% in just four months. At $97, it ultimately found support, pointing to the possibility of a reversal. Prologis’ stock has been moving in a parallel channel pattern for the past year between $137 and $98.
It is expected that the price of Prologis Inc. (PLD) stock price will continue to decline towards its next support level based on the analysis in the weekly period. The price is now trading close to the EMA level and the price structure shows a weak pattern. The EMA is also displaying contraction, which denotes weakness in strength.
Prologis Inc.’s (PLD) profit margin has fallen to 39.1% from 70.9% when it is compared to the previous year. This is a negative news for the Prologis Stock and bulls might find an opportunity.
Prologis has a Price to Earning (P/E) ratio of 42.5x, which is a higher than the average of peer’s group ratio of 41x and this suggest that Prologis is slightly costly. Also, Prologis’ P/E ratio is lower in comparison to worldwide industry average P/E ratio which is at 15.8x, this indicates that the price of PLD can face a downfall in future.
Furthermore, Prologis (PLD) is expected to grow by 7.55% which is close to less than 50% from the market growth rate. This will lead to negative impact on stock.
Prologis Inc. (PLD) Stock Price Analysis
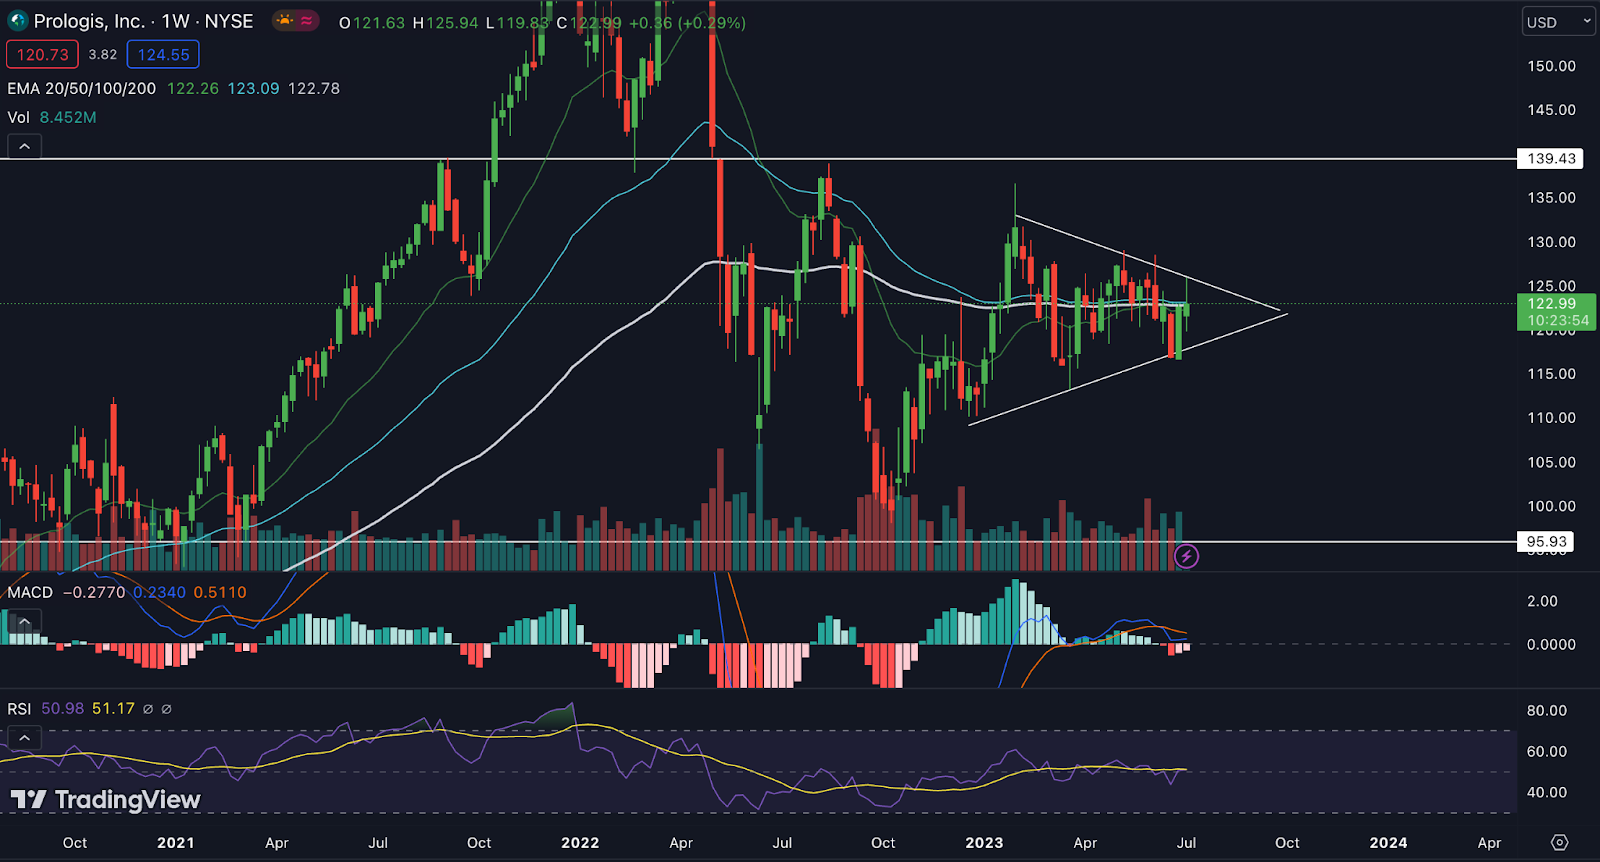
There are multiple negative indications that are clear from the PLD stock chart analysis. Market weakness is indicated by the price’s current trading below the exponential moving average (EMA). Additionally, the constricted EMA lines point to a weakness in the general market attitude.
Furthermore, the fact that the MACD line is below the signal line reinforces the stock’s weakness and suggests a possible collapse in the days to come.
Further confirming the idea that the PLD stock is weak, the Relative Strength Index (RSI) line is below the Simple Moving Average (SMA) line. Indicating the weakness in stock price.
Conclusion
In conclusion, by looking at the chart of Prologis Inc. in the weekly timeframe we can say that the price structure is weak and there is a possibility of further fall.
Technical Levels
- Support – The current support level of Prologis Inc. Co. (O) is $115.
- Resistance -The current resistance level of Prologis Inc. Co. (O) is $139.
Disclaimer
The views and opinions of the author, or anyone named in this article, are for informational purposes only. They do not offer financial, investment, or other advice. Investing or trading crypto assets involves the risk of financial loss.




