Dacity Coin
 Celestia
 Quantus
 Bitcoin
 Pearl
Pearl Pons
Pons Injective

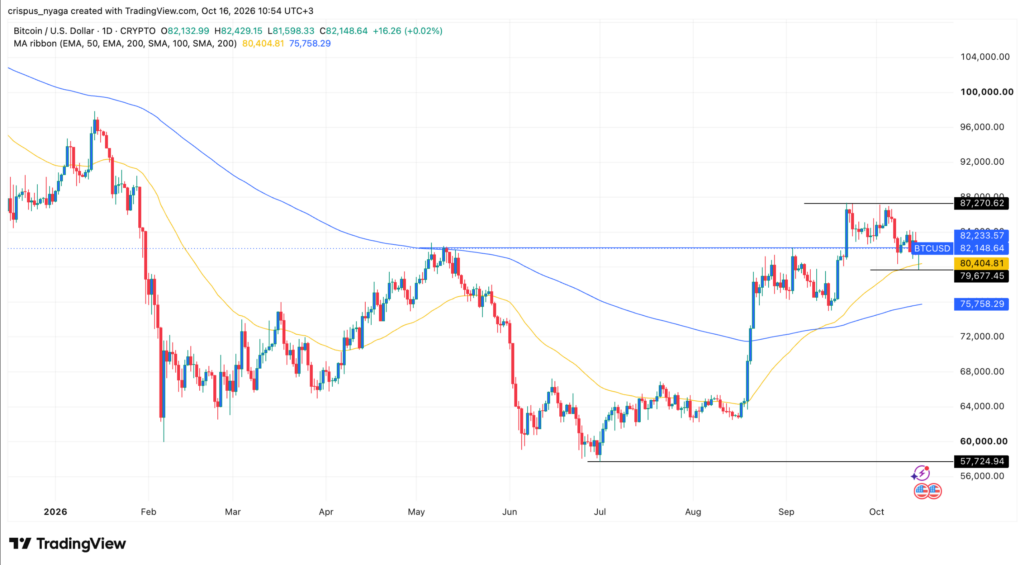
The crypto market showed signs of stabilization on Oct. 16 as investors reassessed the Federal Reserve’s interest rate outlook. Bitcoin traded near $82,150, recovering from this week’s reported low near $79,677.
Ethereum also rebounded toward $2,450, while XRP attempted to recover from its recent decline. However, the three cryptocurrencies continued facing different technical challenges.
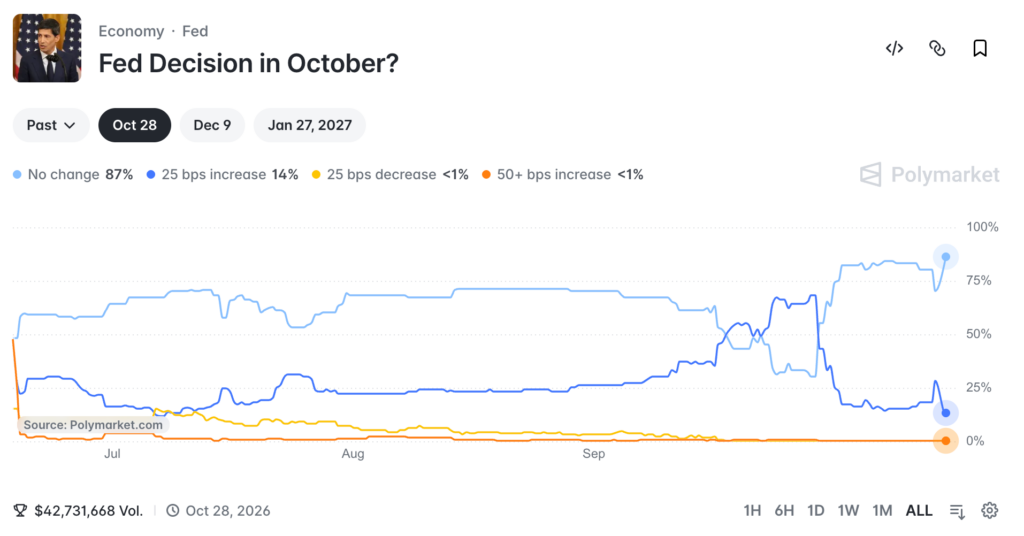
The recovery followed comments from Federal Reserve Chair Kevin Warsh that reduced expectations for another October rate increase. Investors also monitored persistent inflation and weak cryptocurrency ETF demand.
Crypto Market Steady as Odds of Fed Cutting Rates Fall
Bitcoin, Ethereum, and XRP prices have moved sideways as investors react to the latest consumer inflation report and the falling odds that the Federal Reserve will hike interest rates this month.
The US published strong consumer and producer inflation data. The headline and core consumer inflation numbers rose 3.7% and 2.7% in September, higher than what analysts were expecting.
Similarly, the headline and producer price index were also higher than what analysts were expecting. These numbers have moved further away from the Federal Reserve’s target of 2.0%, which, in theory, should push officials to hike later this year.
However, there are signs that the Fed will not hike this month. In a statement at an IMF meeting, Kevin Warsh, the head of the Federal Reserve, sounded noncommittal on whether the bank will hike rates this month. Odds of the Fed hiking rates this month have continued falling on Polymarket and Kalshi.
Bitcoin Price Prediction: Technical Analysis
Bitcoin has moved sideways in the past few weeks. This performance has coincided with the waning demand in the ETF market. Data shows that these funds have had over $534 million in outflows this month. In total, these funds have had cumulative inflows of over $56.8 billion and now hold $105.7 billion in assets.
The daily chart shows that Bitcoin has staged a strong comeback in the past few months. It soared from a low of $57,725 in July to a high of $87,270.
A closer look at the chart shows that it has settled at an important support level, which coincides with the highest level in May and September 9 this year. It has also formed a golden cross pattern, a common bullish continuation sign.
Bitcoin has also remained above the Supertrend indicator. Therefore, the coin will likely have a bullish breakout, potentially to the key resistance level of $87,270. A move above that resistance level will point to more gains.
Ethereum Price Prediction: Technical Analysis
ETH price has remained inside a narrow range in the past few days. It was trading at $2,450 on Friday, down modestly from last month’s high of $2,800. The coin is trading at the important level of $2,353, its lowest level on August 23, September 2nd, and September 15.
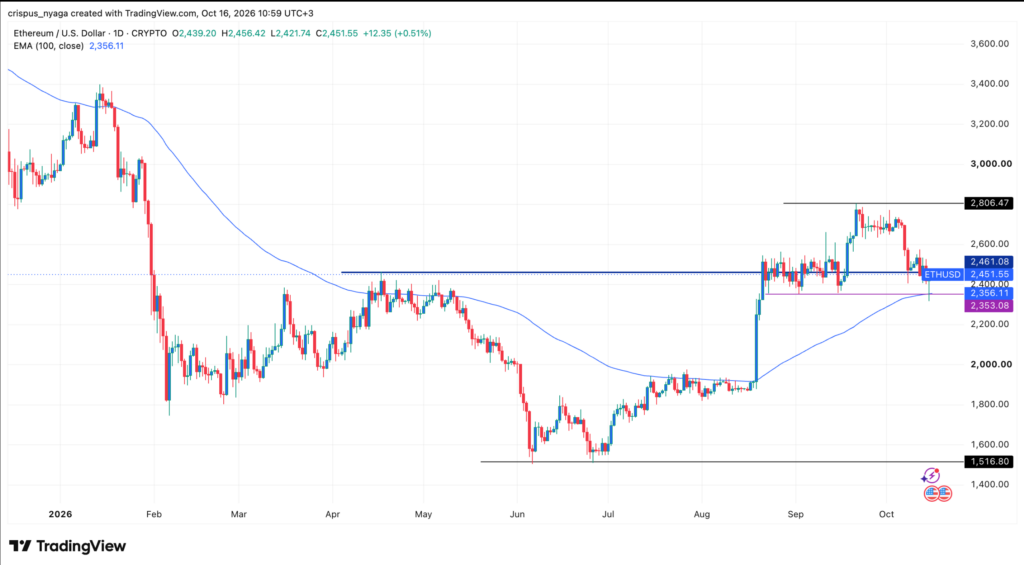
This performance is a sign that the coin has found a strong support level. The current level is also its highest level on April 18 this year. Therefore, the token may bounce back soon, potentially to the key resistance level of $2,806. A move above that level will raise the odds of it moving to $3,000.
XRP Price Prediction: TradingView
The daily chart shows that the XRP price has been in a tight range in the past few days. It has settled at the 100-day Exponential Moving Average (EMA). The risk, however, is that the coin has formed a double-top pattern, which often leads to a bearish reversal. It has also formed a bearish divergence pattern as the Relative Strength Index (RSI) has moved downwards.
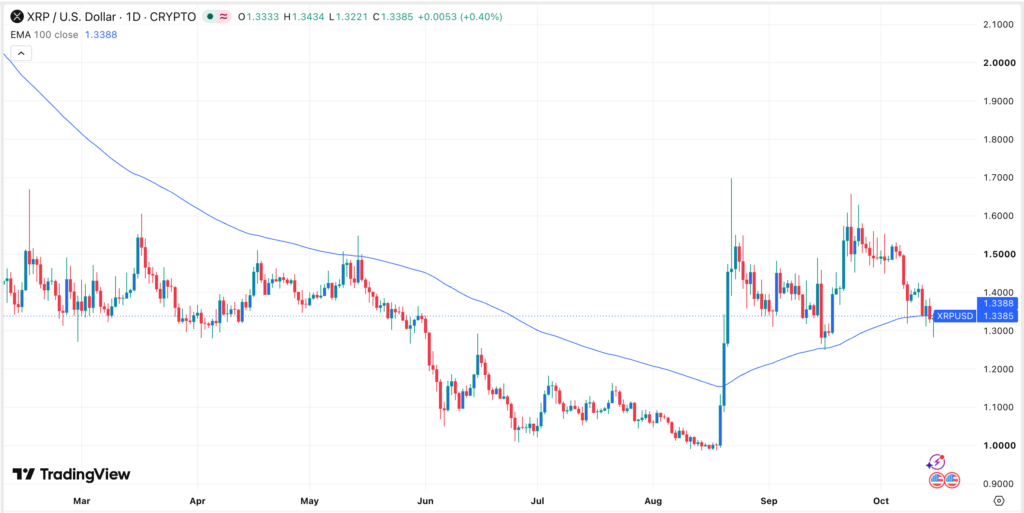
Therefore, the coin will likely have a bearish breakout, potentially to the key support level of $1.00 in the near term. The alternative scenario is where the token rebounds and moves to the psychological level of $1.500.
This article is for informational purposes only and does not constitute financial or investment advice.