
 Sword Inu
 no crying in the casino
 streamoors
 IGNITION
 Altai the Tiger
 Pearl
Pearl Quantus
- Msci Inc. stock price is trading below 20-day, 50-day and 100-day Exponential Moving Average levels.
- Msci Inc.’s stock price is currently trading at $469.46 and rise by 0.4% in 24 hours.
- Msci Inc. (MSCI)’s live market cap is $37.59 Billion.
Since November 2021, the price of MSCI stock has been trending downward, and by mid-2022, it has dropped significantly by 45%. The price is close to the support level and is building a symmetrical triangle pattern. The probability of a price breakdown and the formation of fresh swing lows is very strong.
MSCI stock price overall structure suggests weakness as a consequence of the price’s repeated failures to break above the triangular pattern, which led to a reversal.
Msci Inc. stock seems expensive from a fundamental point of view. MSCI P/E ratio is 42.7X, which is more than the average P/E of 38.6X. This means that about its expected earnings, the stock may be overpriced.
Also, MSCI stock’s profit growth expectation is 12.2% per annum, whereas the US market’s profit growth is 15.6% per annum. This indicates that the profit growth expectation of MSCI stock is lower than that of the overall market.
A bigger worry than short-term assets not meeting short-term liabilities is the fact that MSCI stock price has negative shareholder equity. When a firm has negative shareholder equity, it means that its obligations are greater than its assets, which may be a sign of financial instability.
Msci Inc. (MSCI) Stock Price Analysis
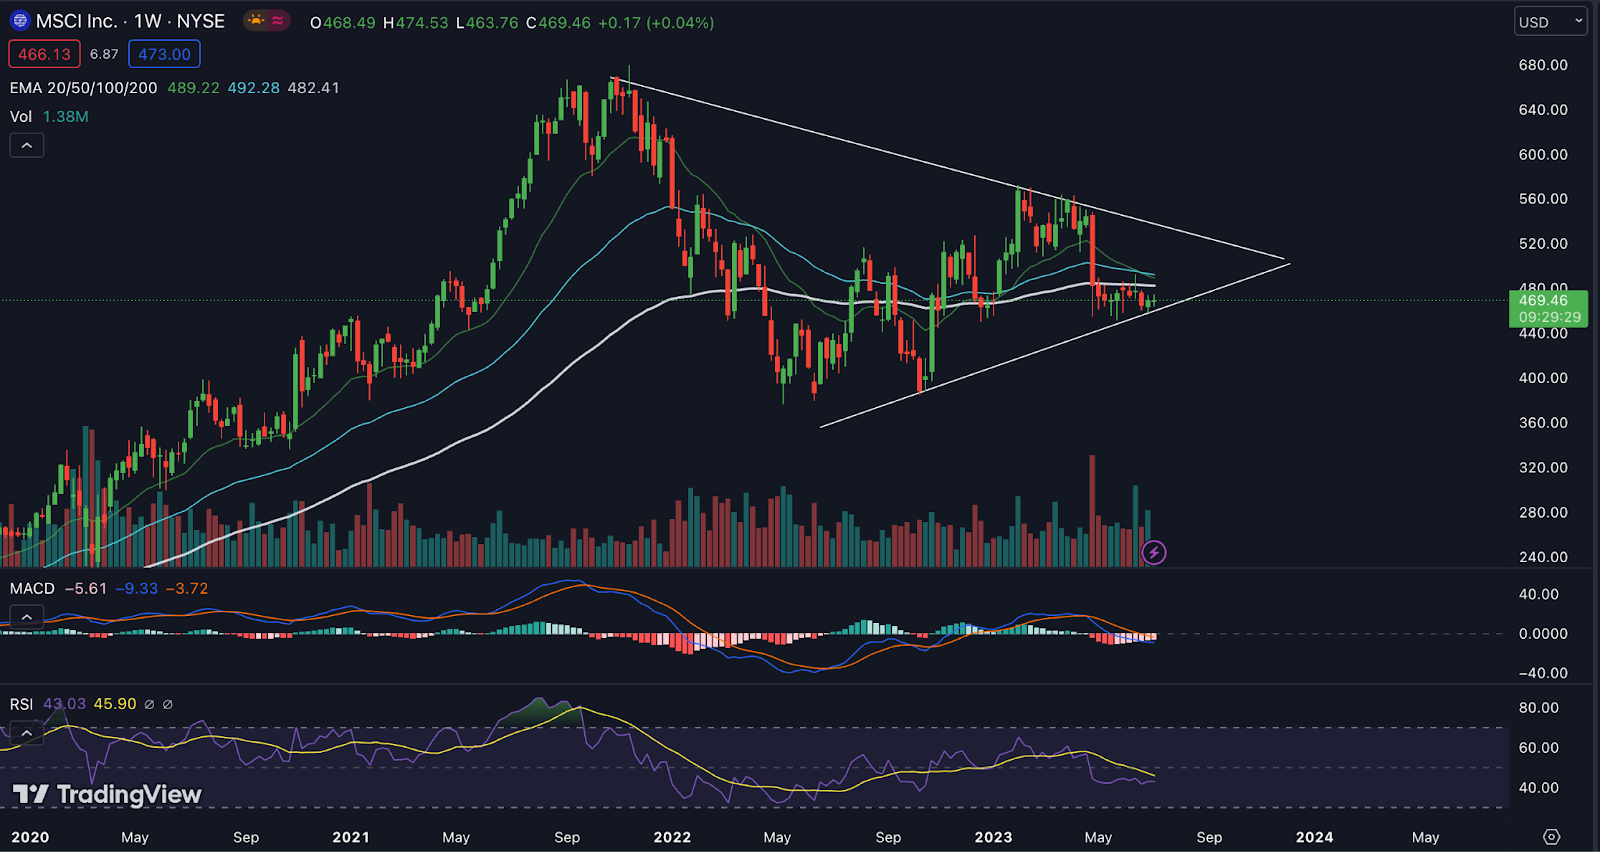
Future declines in MSCI’s stock price are possible given that it is now trading below the EMA level. This is frequently considered a bearish indication.
It is possible to consider the appearance of a red histogram on the MACD, which denotes negative momentum, as a bad indicator for the MSCI stock.
The stock may be in a weak structure if the RSI line is below the SMA line. This suggests that there may be more pressure to sell than to acquire.
It can be seen from the chart analysis that the stock’s volume is decreasing. This declining volume points to a lack of major purchasing activity and could suggest additional stock price declines. When volume declines as prices are falling, it indicates a decline in market mood and the potential for the negative trend to continue.
Conclusion
In summary, the study as a whole indicates that MSCI stock price is creating a weak structure at the moment, raising the possibility of a price breakdown and the creation of new swing lows. When compared to the larger market, MSCI’s fundamentals, such as its Price-to-Earnings ratio and earnings growth rate suggest probable weakness. A probable price fall in the future is also being signaled by technical indicators.
Technical Levels:
- Support – The current support level of MSCI is $460.43.
- Resistance – The current resistance level of MSCI is $555.64.
Disclaimer
The views and opinions of the author, or anyone named in this article, are for informational purposes only. They do not offer financial, investment, or other advice. Investing or trading crypto assets involves the risk of financial loss.



