
 astronaut
 Zylo Ecosystem
 Pearl
Pearl Quantus
 Bitcoin
 Sui
Sui Bitway
- The SANB stock is trading at £121 and not witnessing any gain or loss during the intraday session.
- The year-to-date return of SANB stock is -1.31% and the three-month return is -3.97%.
Santander UK plc’s (SANB) stock price has followed a downward trajectory since Feb 2023. The stock reached a £114 support level after experiencing an intense pullback. Subsequently, it bounced back strenuously and recorded an impressive spike of approximately 11%. This bullish trend encountered resistance at £127, which halted further price progress.
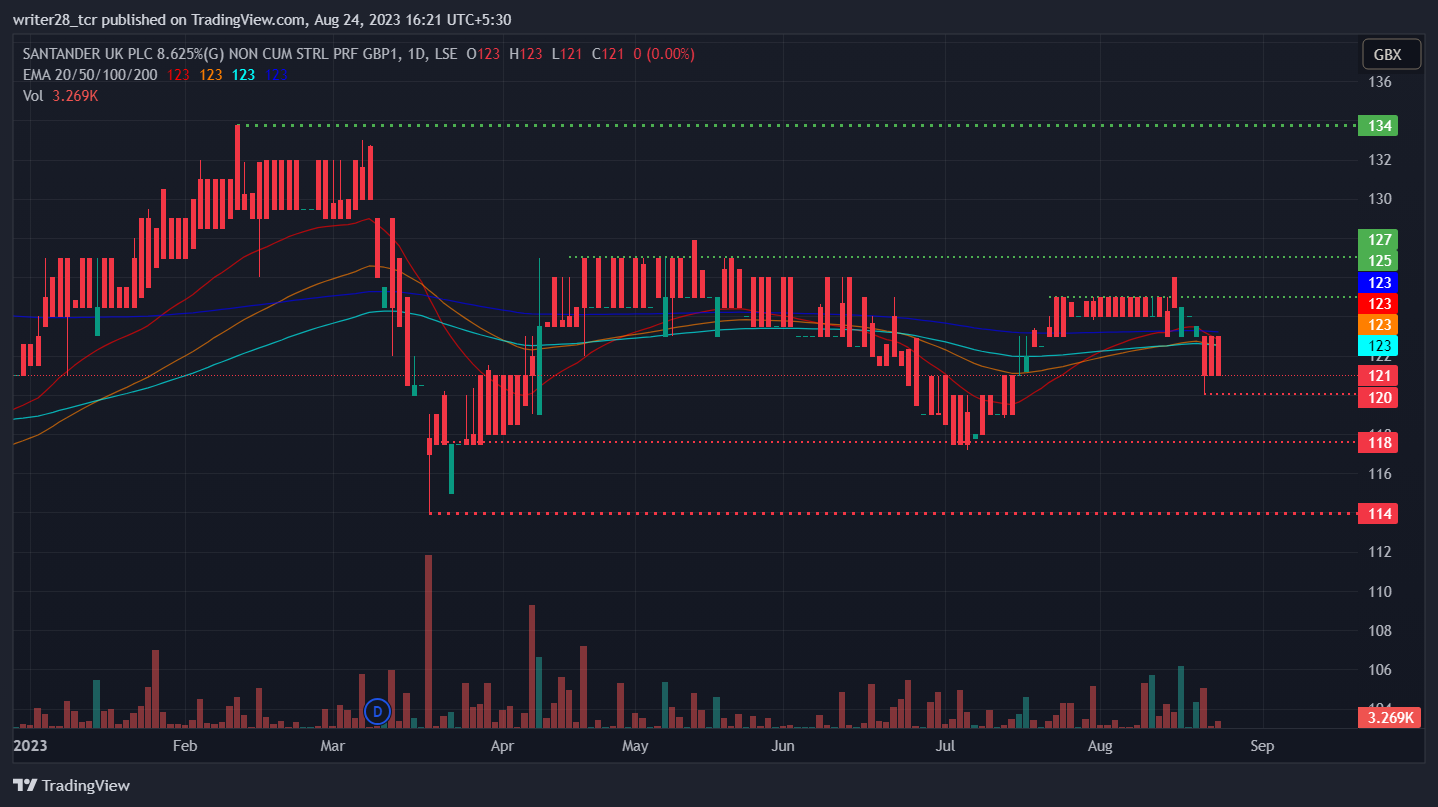
The Santander stock is currently hovering near the previous crucial support level of £120. It is indicating a bearish momentum in the market. It is trading at £121 with neither gain nor loss in the past 24 hours.
With no sign of gain or loss, the stock price might continue to sustain the bearish momentum. If the bears remain in power, the price might melt. It may retest the previous support level of £120 and further to the crucial support level of £118.
On the contrary, if bullish momentum rises and changes the price action trajectory, the price might surge. It may retest the previous resistance level of £123. The existing scenario in the candlestick chart doesn’t reflect any substantial outcome.
The Ascension of King Charles III Out-turn
The British multinational retail banking company experienced a bearish trend in price action after the ascension of King Charles III. It triggered the currency shuffle-up.
The UK is now reprinting currency bills and featuring the new King Charles III on banknotes. Those bills are expected to enter circulation by mid-2024. This currency shuffle-up is observed throughout the Santander stock market. However, the SANB stock reflects an opposing result in all returns.
Will SANB Stock Retests the 118 Mark?
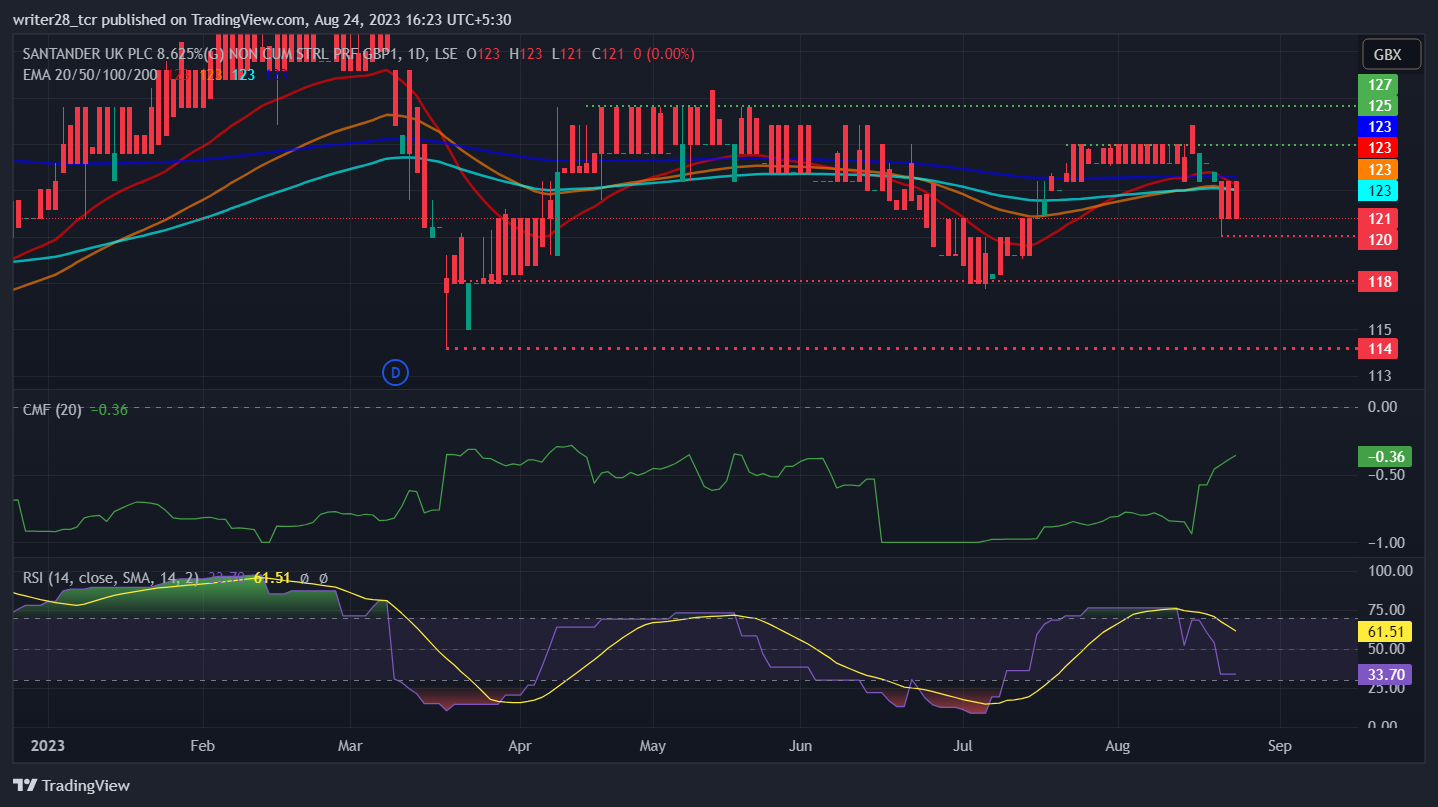
The Chaikin money flow (CMF) has been trading below 0 since the start of 2023. It scored -0.36, indicating heavy participation of sellers throughout the year.
The SANB stock trades below the 0, 50, 100, and 200-day EMA. It indicates weakness in the market and the rise of bearish momentum in the market.
The relative strength index (RSI) trades at 33.70, denoting solid bearish momentum in the market during the intraday session.
Conclusion
The market sentiment of SANB stock reflects weakness in the market. However, the recent development perfectly displays the reason behind the downward trend. Furthermore, investors should look for selling opportunities because the technical indicators reflect the same.
Technical Levels
- Major support: £114 and £115
- Major resistance: £134 and £128
Disclaimer
The views and opinions stated by the author, or any people named in this article, are for informational purposes only. They do not establish financial, investment, or other advice. Investing in or trading crypto assets comes with a risk of financial loss.



