
 Bitcoin
 Pearl
Pearl Starknet
 Zerebro
 NEAR Protocol
 Solana
 Quantus
- Deutsche Bank has maintained a “BUY” rating on the Mondelez International stock price.
- Mondelez International stock price made a new yearly low of $60.75 on 12 October 2023
- Wall Street expects that the company might report some growth in earnings.
The Mondelez International (NASDAQ: MDLZ) stock price has been on a dream run since 2009, as it has been in a strong uptrend since then. If we observe the price action of the stock for this year, it showed a strong surge at the beginning of this year. However, this surge was halted in the middle of the year and the price started to decline in May 2023. It has melted by 20% from the highs, which is considered a good correction.
The MDLZ stock price has strongly recovered from the yearly low level, which it reached on 12 October 2023. It is moving about 9% above this level, which is a positive sign for investors. The bulls have stepped in, as the stock price has surged in 8 of the last 11 trading sessions. However, in the previous two trading sessions, the stock price has indicated the presence of bears.
Deutsche Bank has maintained its previous rating of “BUY” on MDLZ stock. However, it cut down the target price from $80 to $75. Furthermore, Mondelez International will release the earnings report on 1st November, and Wall Street expects that the company will post a growth in earnings.
Synopsis of the Mondelez International Stock Chart
The MDLZ stock price has been in a strong downtrend since May and the buyers are trying to change this trend. In the middle of September 2023, the stock price witnessed a massive fall without showing any retracement. Such a dramatic decline is typically not sustained for a long time.
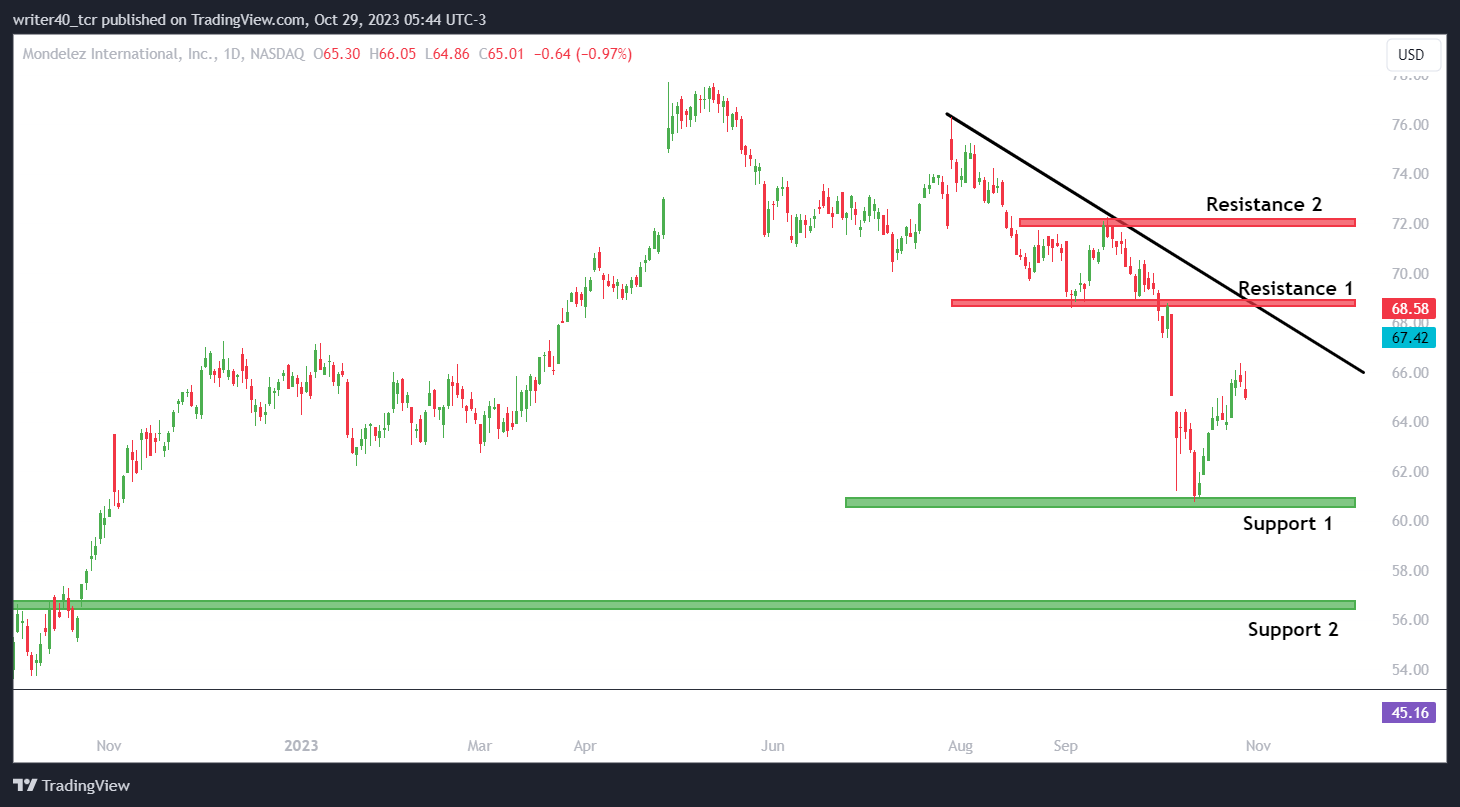
The MDLZ stock price is still recovering from its fall and is struggling to continue its recent bullish trend. Both support and resistance for the stock price are far from the current market price. The resistance levels for the stock are present at $68.89 and $72.18. The supports are present at $60.51 and $56.44.
Outlook of the Exponential Moving Averages and Relative Strength Index
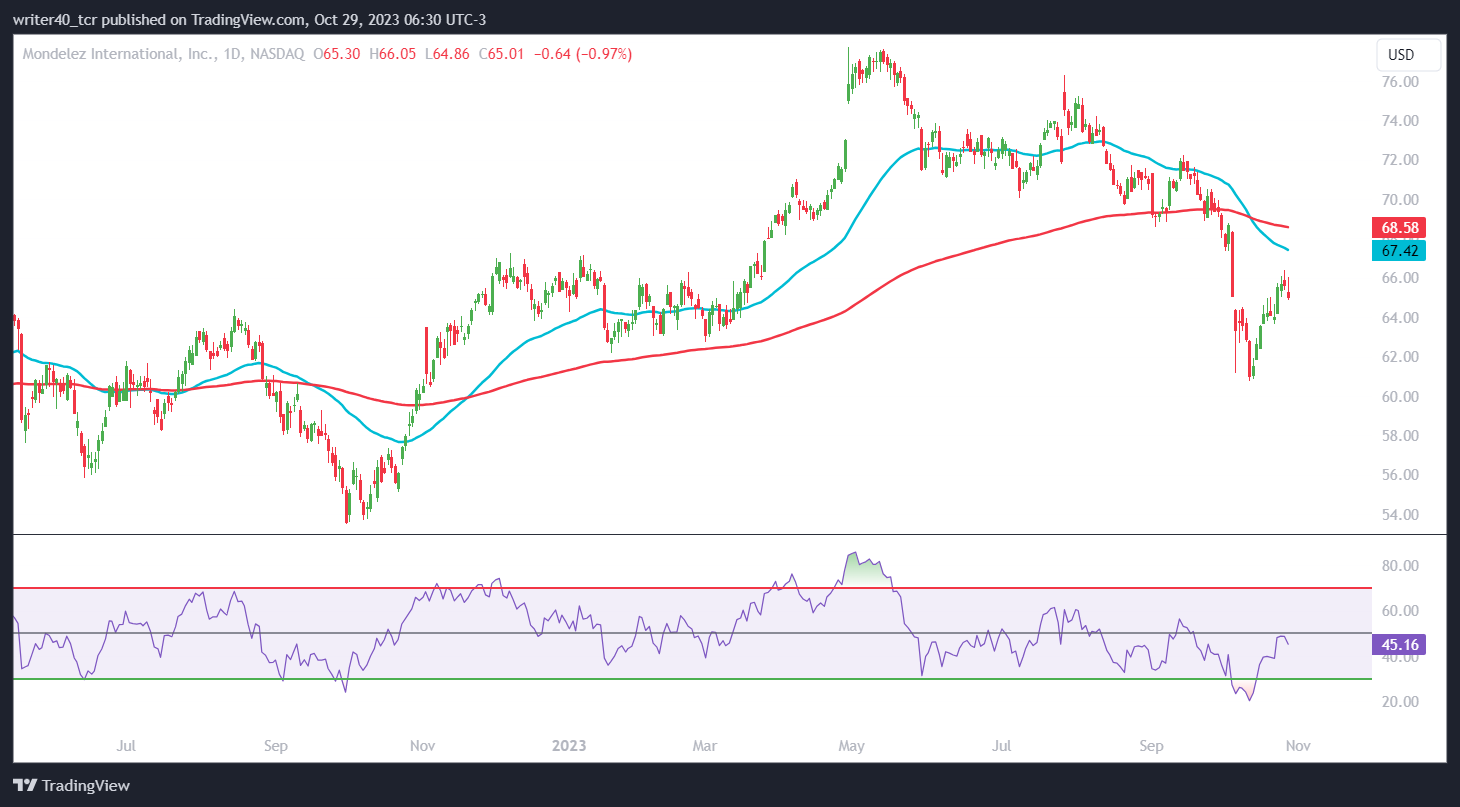
The MDLZ stock price is situated below the 50-day exponential moving average (EMA) and the 200-day EMA. It is currently facing resistance from a slightly lower level than the EMAs. The relative strength index (RSI) is giving a bearish sign for the stock, as it is curving at the level of 45.16.
Conclusion
In the past few months, the MDLZ stock price has been dominated by the bears and it is recovering from the fall. The market is expecting that the company will report growth in its earnings, which would be positive news for the company. However, several rating firms have cut down the target price of the stock, which is negative.
Technical level
Resistance – $68.89 and $72.18
Support – $60.51 and $56.44
Disclaimer
The views and opinions stated by the author, or any people named in this article, are for informational purposes only. They do not establish financial, investment, or other advice. Investing in or trading crypto assets comes with a risk of financial loss.



