
 Bitcoin
 Aerodrome Finance
 Zerebro
 Starknet
 Zama
Zama Pearl
Pearl ZKsync
- The DIS stock has a constant beta of 1 which indicates that the stock price is stable.
- The Walt Disney Company stock is currently trading at a level of $84.02.
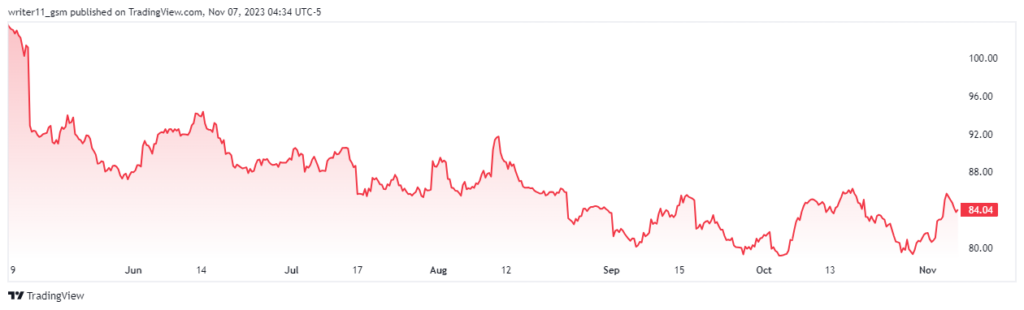
The current CEO of the Walt Disney Company is Robert A. Iger and the company operates in the movies and entertainment industry. The company further has its headquarters in Burbank and has 220K employees. It was founded in the year 1923.
The company used to pay dividends to its shareholders but hasn’t paid any in the last two years. This is concerning as the company might be losing its profit due to which it stopped paying dividends to its shareholders.
The Walt Disney Company has a price-to-earnings ratio of 69.08 which shows that the investors are willing to pay higher prices for the stock. The company has 1.83B shares floating in the market out of which 0.05% shares are closely held by the investors.
The DIS stock is trading with a basic EPS of 1.23 USD which shows that the company is profitable. Also, the PB ratio of the company is 1.57 following a debt/equity ratio of 48.34%.
The Walt Disney Company Stock Performance Analysis
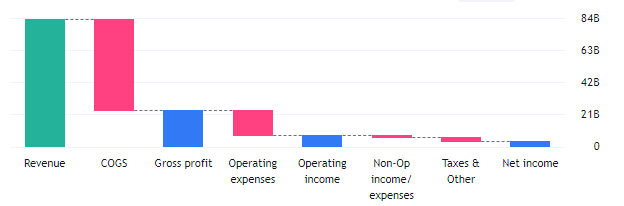
The company makes the largest amount of revenue from America by Disney Media and Entertainment distribution and the reported revenue of the company is $82.58B. The resulting net income of the company is $3.15B following a profit margin of 3.81%. The company incurred a COGS of $59.426B and the gross profit of the company is $23.154B.
Will DIS Break Above The Resistance To Lead To New Highs?
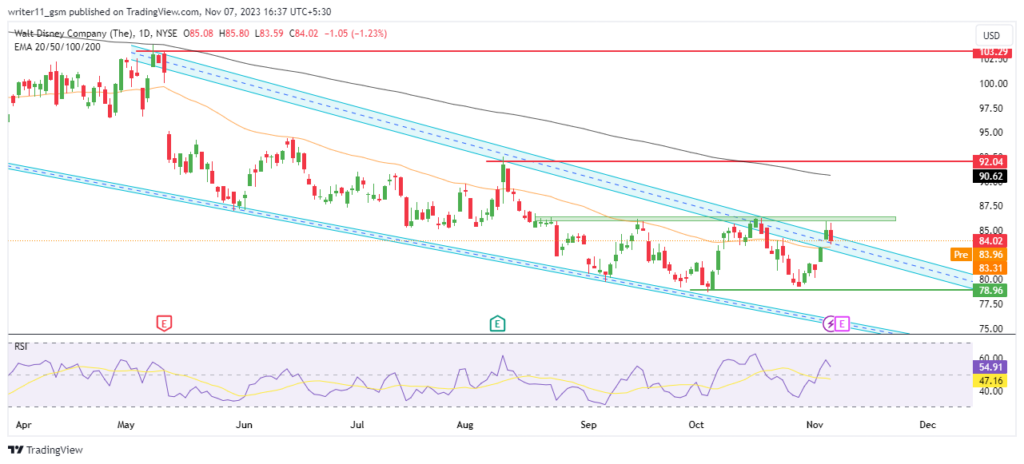
The DIS stock price is slowly sliding to the lower levels with the decline in the stock price. The following behavior of the stock has led to the falling wedge pattern on the charts.
The DIS stock price has broken out above the falling wedge pattern but has not formed any reliable chart pattern that could sustain the breakout levels. The share price is also taking resistance at the crucial supply zone. If the stock breaks above the level and sustains at the same, it can lead to much higher levels.
The 50-day and the 200-day EMA are following a death cross on the charts and the stock price has advanced above the 50-day EMA. This indicates that the stock is gaining momentum but it cannot be confirmed unless the prince breaks above the 200-day EMA. The RSI for the DIS share price is trading at a level of 54.91 on the daily timeframe and currently represents volatility on the charts.
Conclusion
The DIS stock price is indicating signs of bullishness on the charts. The financials of the company are also reliable and huge. Despite the decline in the profit margin, the company has a good PB ratio. On the technical charts, the price has broken out above the falling wedge pattern.
Therefore, if the DIS stock price sustains above the wedge pattern and breaks above the level of $87.00, we might witness further advances in the stock price to higher levels.
Technical Levels
- Support levels- $70.00 and $79.00
- Resistance levels- $92.00 and $103.00
Disclaimer
The information provided in this article, including the views and opinions expressed by the author or any individuals mentioned, is intended for informational purposes only. It is important to note that the article does not provide financial or investment advice. Investing or trading in cryptocurrency assets carries inherent risks and can result in financial loss.



