
 Dacity Coin
 Injective
 Starknet
 NEAR Protocol
 Pearl
Pearl Quantus
 Pump.fun
- HP Inc. stock has a beta of 1.19.
- The MACD indicator of HPQ stock has formed a red histogram.
Hewlett Packard Development Company, L.P. offers a variety of computer and other electronic access devices, along with imaging and printing products. The company operates through distinct business segments, namely personal systems, printing, and corporate investments.
Financial Data of HP Inc. (NYSE: HPQ)
HP Inc. stock is currently consolidating near the resistance level, indicating a range-bound trading scenario and neutral momentum.
According to the technical indicator summary provided by TradingView, HPQ stock is given a neutral signal. Among the 26 indicators, 9 recommend a sell signal, and the rest suggest a buy signal. The moving averages summary also indicates a neutral stance.
With a beta of 1.19, HP Inc. stock is considered relatively non-volatile, reflecting a safer investment option with less abrupt momentum shifts.
The target price for HPQ stock in the upcoming year is projected at $30.19, representing an 11.7% increase from the current price, providing a positive outlook.
HP Inc. consistently pays dividends to its shareholders, with a dividend payout of 46.17% and a payout ratio of 86%.
After hitting a swing low at $25, the stock price of HPQ reversed its trend and is currently moving upward within a channel pattern. The recent consolidation near the $27.7 resistance level suggests a potential breakout, leading to further upward movement.
Moreover, the actual earnings of HP Inc. surpassed estimated earnings, indicating an overall improvement in the company’s performance.
HP Inc. (HPQ) Technical Analysis
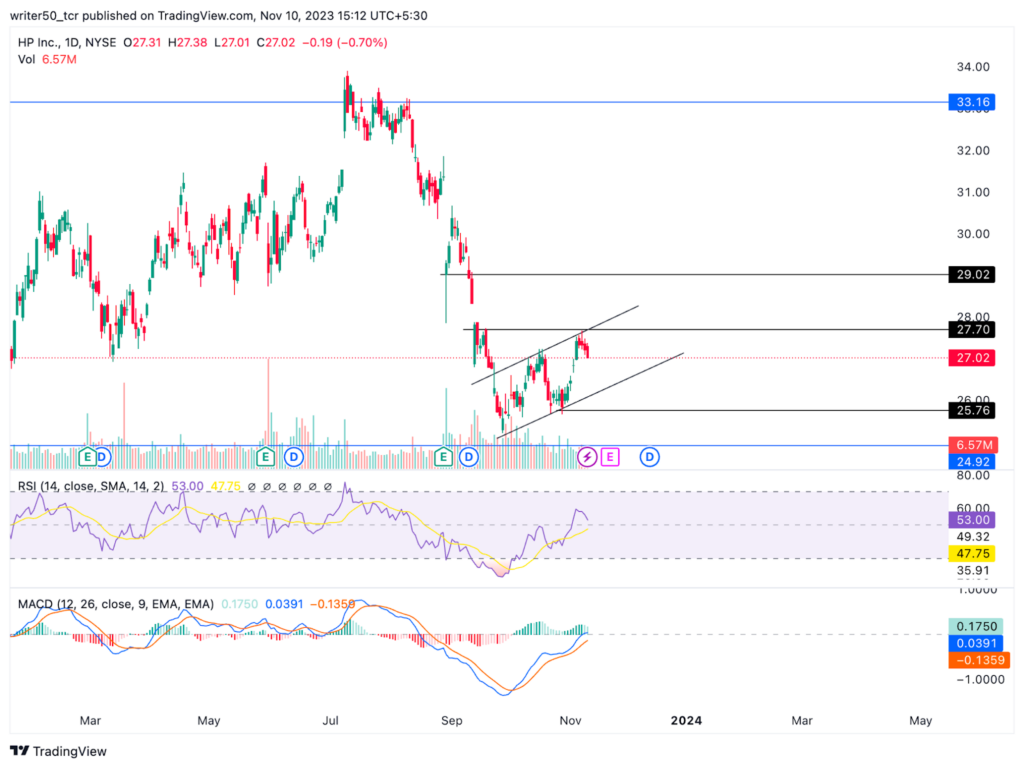
The HPQ stock exhibits a MACD line positioned above the signal line, accompanied by a green histogram formation. This signals a bullish trend, suggesting a potential price increase in the upcoming days.
Additionally, the RSI line for HP Inc. stock is situated around the 53 level, indicating a positive zone. This suggests the formation of a robust pattern, further anticipating a price rise in the future.
Conclusion
The HPQ stock is moving upward after hitting the support level. The price is near the resistance level and the technical indicator summary is giving a neutral signal. The actual earnings of the company are also equal to the expected earnings. Thus, if the price breaks above the resistance level of $27.7, a further uptrend can be seen in the upcoming days.
Technical Levels
- Support Levels: $25.7 and $4.9
- Resistance Levels: $27.7 and $9.02
Disclaimer
The views and opinions of the author, or anyone named in this article, are for informational purposes only. They do not offer financial, investment, or other advice. Investing or trading crypto assets involves the risk of financial loss.




