
 astronaut
 Zylo Ecosystem
 Pearl
Pearl Quantus
 Bitcoin
 Sui
Sui Bitway
- Bitcoin ETF inflows have witnessed a surge over time.
- BTC has witnessed a huge surge in its trading volume.
A recent X post by @QuintenFrancois shows a chart of inflow in Bitcoin ETFs. It shows a strong surge and advance over time. It also shows that the crypto’s ETF is performing very well, and a large chunk of investors are interested in it.
Almost 26,000 $BTC bought last week
— Quinten | 048.eth (@QuintenFrancois) June 10, 2024
Will this week be even bigger for the #Bitcoin ETFs? pic.twitter.com/itxQMzkBM4
Further ahead, we can look at the charts and see that on June 7, 2024, the BTC ETF witnessed an inflow of $25.9K, resulting in a net investment of $266.3K. The following inflow is ten times bigger if compared with the previous month’s inflow.
The value of the Bitcoin crypto traded volume has advanced by 95% in just the last 24 hours from the press time. This further resulted in a traded value of $28.594B, which led to a volume/market cap ratio of 2.09%.
Bitcoin is the largest cryptocurrency in the global crypto market. Its market cap has declined by 2.7% in the last 24 hours, showing weakness in the coin’s price.
At press time, 93.86% of Bitcoin’s maximum supply is circulating in the market, while the crypto price volatility is medium. The supply inflation of the crypto is also very low at 1.58%, which is a positive sign for the crypto.
What Do Derivatives Say About the Crypto?
The derivatives trading volume of the crypto has also witnessed a surge of 124%, followed by an advance in the crypto’s spot volume. Despite this, the options volume has declined over the last 24 hours.
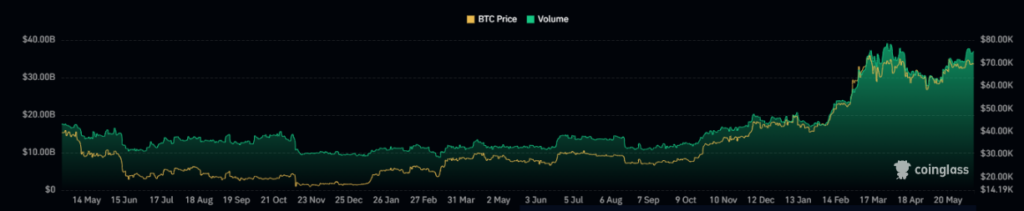
The Bitcoin Crypto derivatives volume chart also shows that the derivatives volume has surged over the last few days. It shows an advance in the crypto trading activity and more engagement of traders.
Moreover, the long liquidation recorded for the crypto in the last 24 hours is much higher, resulting in $24.68M. This shows bears’ dominance in crypto following recent times.
What Does the Bitcoin Technical Chart Reveal About the Price?
The BTC crypto price broke below crucial levels, followed by a rising wedge pattern.
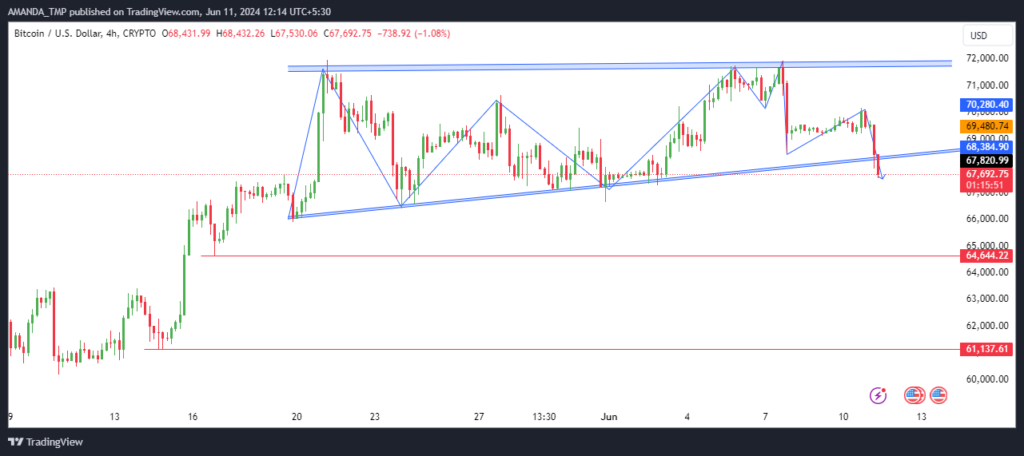
After consistently advancing to certain highs, the price of the BTC crypto started to consolidate on higher levels, followed by a certain dynamic range. This behavior of the price led to the formation of a rising wedge pattern.
Moreover, the most recent price action shows a breakdown in price below the rising wedge pattern. The breakdown in BTC crypto price is followed by strong bearish candles formed in a sequence. A lower low swing on the chart further follows that.
The following behavior of the chart shows a higher chance of a decline in the price to further lower levels recently.
BTC/USD Chart by TradingView
While the 50-day and the 200-day EMAs are trading in a golden crossover on the 4H chart. Its price has broken below the 200-day EMA, showing the loss of bullish momentum in the trading price.
The MACD indicator further gives a fresh sell signal on the chart, followed by a bearish crossover in the MACD and the signal line trading in the negative trajectory.
The RSI shows a loss of bullish momentum and a surge in bearishness as the RSI declines to the level of 29.45 at press time. It has also broken below the 14-day SMA.
Summary
The Bitcoin price has broken crucial support levels, indicating potential further declines. Despite a surge in ETF inflows and trading volume, bearish signals like high long liquidations, a breakdown from a rising wedge pattern, and bearish technical indicators dominate and suggest short-term bearish momentum.
Following the short-term downtrend in BTC crypto, it might take support at the levels of $61,100 and $64,644. Additionally, the resistance levels for the crypto are $70,100 and $71,800.
Disclaimer
This article is for informational purposes only and does not provide any financial, investment, or other advice. The author or any people mentioned in this article are not responsible for any financial loss that may occur from investing in or trading. Please do your research before making any financial decisions.




