
 astronaut
 Pearl
Pearl Zylo Ecosystem
 Bitcoin
 Bitway
 NEAR Protocol
 Zcash
Zcash
- The Brett crypto is highly volatile, displaying a volatility of 8.33%.
- Over the last 1 year, the crypto price rose by 185%.
The Brett price displayed profit booking over the last few days, resulting in a breakdown in price below crucial levels.
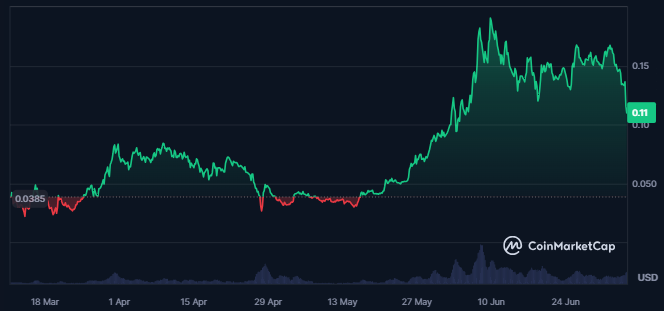
The market cap value of the crypto has declined by 22% in the last 24 hours, resulting in a market cap value of $1.087 Billion. Despite this, Brett has a strong position in the market and is the 59th largest cryptocurrency in the global crypto market.
During the decline in price, trading volume had advanced by 53%, reflecting negative sentiments among investors.
The crypto further has medium liquidity as 6.53% of the crypto market cap is traded in the last 24 hours from the spot time. Also, 99.10% of the maximum crypto supply is circulating in the market, which resulted in a circulating supply of 9.91B BRETT.
The maximum supply of the crypto is 10.0B BRETT, with a fully diluted market cap of $1.113 Billion. Additionally, it has a market cap dominance of 0.05%, and the fear and greed index of the crypto is 29, which shows fear among investors.
Brett Crypto Derivatives Data Analysis
A huge surge in the trading volume of crypto derivatives was recorded, which shows a rise in the trading activity of crypto derivatives.
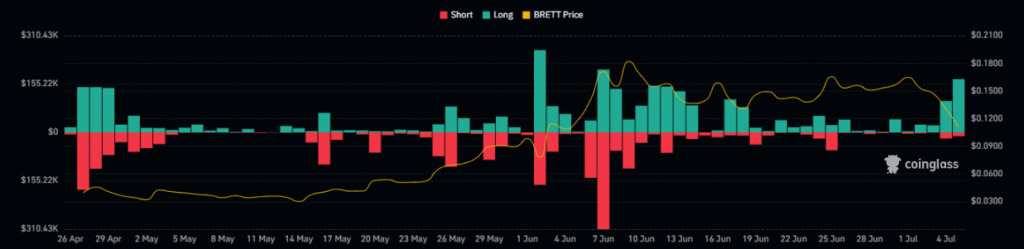
In the past few days, the liquidation chart showed huge long liquidations in crypto. This indicated that sellers have ruled over the price over the last few days, followed by substantial profit bookings in traders’ long positions.
The open interest in crypto declined 30% in the last 24 hours, and a higher long liquidation of $212.10K was recorded. Moreover, the short liquidation is worth only $32.25K.
BRETT Technical Analysis
In the last five months, Brett consistently displayed profit booking, corresponding to a decline of more than 40% in price.
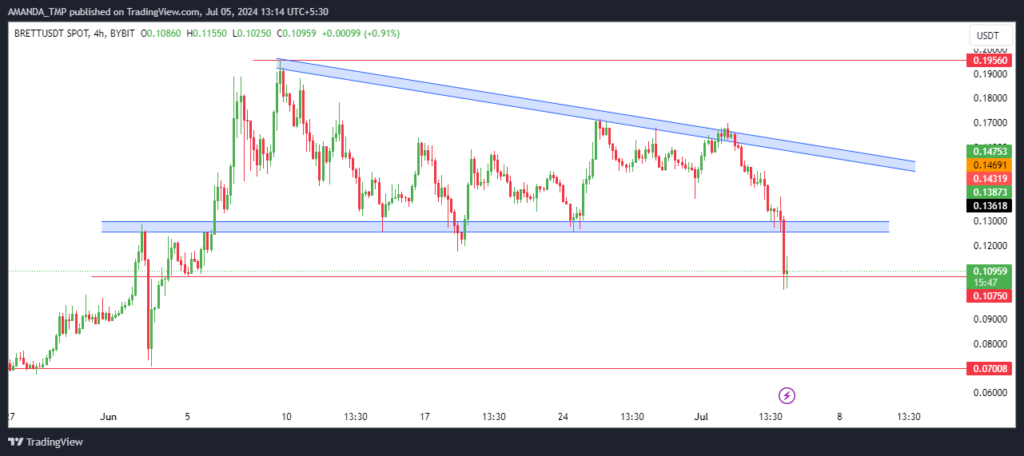
The BRETT crypto price revolved inside a dynamic range for a long time, rersultiing in a falling wedge pattern. The crypto price broke below the same pattern, exhibiting a strong bearish character.
The following behavior of the price shows strong seller dominance, which might mark lower levels in the future.
BRETT/USDT Chart by TradingView
While the 50-day and the 200-day EMAs were trading in a golden cross, the BRETT had declined below both the EMAs. This exhibits a possibility of an upcoming death cross on the charts, resulting in a long-term downtrend.
The MACD indicator further gave a strong sell signal on the chart as the MACD and the signal line declined below zero. The histograms formed on the chart further are bearish.
The RSI has also declined below the 50-level and the 14-day SMA. At press time, the RSI is at a level of 18.3, which shows strong bearishness in the crypto price.
Possibility of More Lows?
Brett price has broken crucial support levels, indicating a bearish outlook. Market cap dropped by 22%, and trading volume surged by 53%, reflecting negative sentiment.
Technical indicators like MACD and RSI signal further declines. The recent price behavior shows strong seller dominance, suggesting more lows ahead. BRETT price might take support at $0.0700 and $0.1070, followed by the resistances of $0.1680 and $0.1950.
Disclaimer
This article is for informational purposes only and does not provide any financial, investment, or other advice. The author or any people mentioned in this article are not responsible for any financial loss that may occur from investing in or trading. Please do your research before making any financial decisions.




