
 astronaut
 Walrus
 Pearl
Pearl Bitcoin
 NEAR Protocol
 Zcash
Zcash Hyperliquid
- Zignaly crypto price gave returns of 1900% in the last 1 year.
- The ZIG crypto sentiment is bullish, as per analysts.
While the peers of Zignaly crypto underperformed over the last 1 year, it outperformed 97% of the top 100 crypto assets. It also outperformed Bitcoin and Ethereum over the last 1 year.
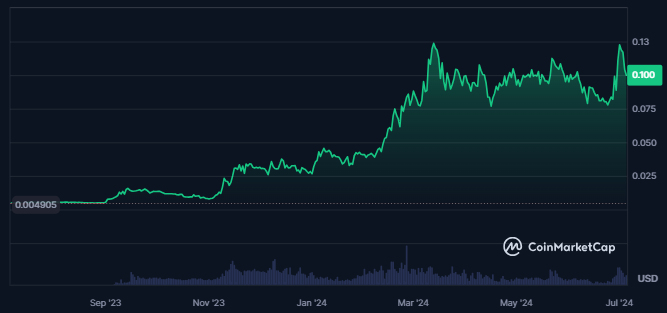
In the last 30 days, the Zignaly crypto price had been trading in green only for 12 days; the crypto was trading with any fiat currency.
ZIG crypto price volatility is very high at 13.18%. This might indicate incoming erratic spikes in the crypto price. The fear and greed index of the crypto further is at 29, representing fear among the investors.
The market cap stood at $145.575 Million, which was up by 7.7% over the last 24 hours from the press time. Also, a surge of 76% in the trading volume of the crypto was recorded, which showed investors’ rising interest in the crypto.
The maximum crypto supply was not disclosed, while the total crypto supply is 2.0 Billion ZIG, and the circulating crypto supply is 1.433 Billion ZIG. This further resulted in a fully diluted market cap of $204.989 Million.
The Zignaly crypto price was trading 2200% above its all-time low price of $0.004315, while the crypto price was down by 53% from its all-time high. The all-time high was achieved three years ago on September 06, 2021.
Holding Pattern Overview of Zignaly Crypto
Zignaly had a total of 9,191 holders at press time, as per CoinCarp data. The top 10 crypto holders also hold 59.44% of the crypto supply.
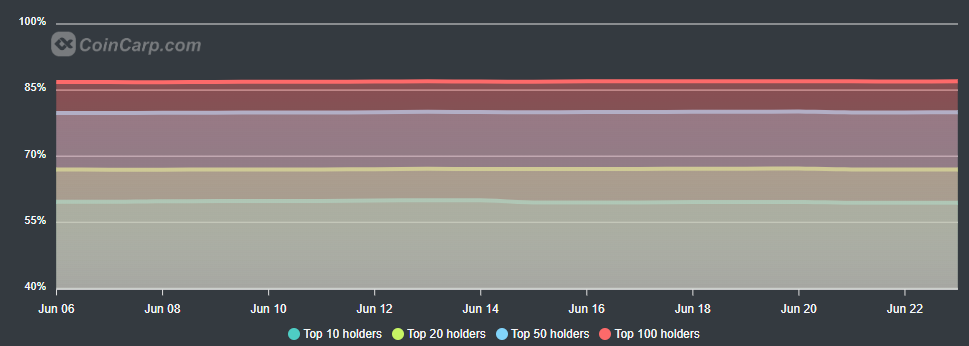
One of the largest holders of Zignaly had 27.25% of the total supply which is 545.0 Million ZIG, and the second largest holder of the crypto has 7.23% of the supply.
This shows that the two entities have control of over 34% of the crypto. Also, Bybit has 36.15% of the supply, and unknown players hold the majority of the supply.
ZIG Crypto Technical Analysis
ZIG crypto price is trading inside a wide-range consolidation zone. The crypto price has been revolving inside the same for the last four months.
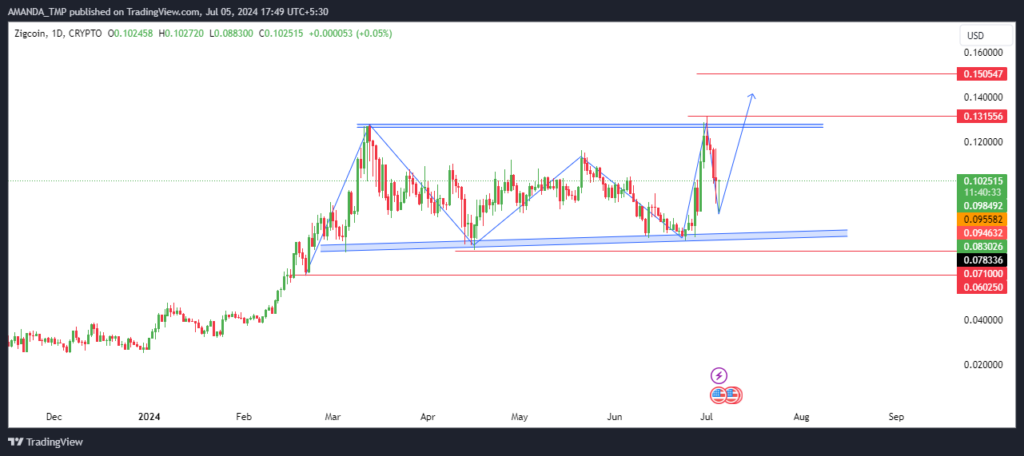
After following a strong uptrend in the price for a long time, ZIG paused, advancing to current levels. If the crypto breaks out above the consolidation zone with strong volume, a strong surge in the crypto price might be seen.
ZIG/USD Chart by TradingView
The ZIG crypto price has advanced above crucial EMAs on the chart, with the 50-day and the 200-day EMAs trading in a golden cross.
The MACD also gave a strong buy signal as the metrics have advanced to the bullish trajectory with the MACD and the signal line trading in a golden cross.
The RSI rose above the 50-level and the 14-day SMA. It has sustained above the same for a long time, reflecting strength in the price momentum.
To Sum Up
Zignaly (ZIG) has surged 1900% in the last year, outperforming most top crypto assets. Despite high price volatility and a fear index of 29, it shows bullish sentiment with a market cap increase and significant trading volume.
The EMAs produced a golden cross and a positive RSI reflects strong price momentum. The support levels for the ZIG crypto are $0.060 and $0.0710. Also, the resistance levels for the crypto are $0.1310 and $0.150.
Disclaimer
This article is for informational purposes only and does not provide any financial, investment, or other advice. The author or any people mentioned in this article are not responsible for any financial loss that may occur from investing in or trading. Please do your research before making any financial decisions.




