
 Bitcoin
 Ondo
Ondo Pudgy Penguins
 Walrus
 Pons
Pons Quantus
 NEAR Protocol
- The Ordinals token price has been trading 1350% above its all-time low price.
- The token price has traded in green for 18 days in the last 30 days.
ORDI has outperformed 88% of the top 100 crypto assets and has also outperformed Bitcoin and Ethereum in the last 1 year.
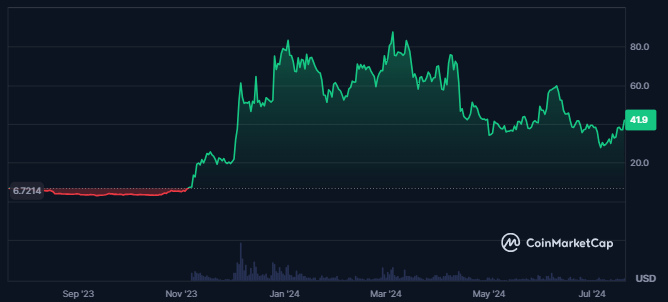
Price Overview Chart of ORDI | Source: CoinMarketCap
The market cap of the Ordinals token has advanced by 15% in the last 24 hours, resulting in a traded value of $875.937M. This further results in a market cap ranking of #78, and the market cap dominance of the token is 0.04%.
The token’s sentiment is neutral, as per the analysts. While the fear and greed index is at 74, greed is shown among the token investors. This shows that buyers are ready to buy the token at higher prices.
Ordinals has 22.1K active addresses; the top 10 holders hold 71% of the token’s total supply. Additionally, the token’s holding addresses have consistently advanced over the last few weeks. Also, the largest holder of the token alone has 42% of the supply.
Ordinals Token Derivatives Analysis
Shorts worth $1.45M have been liquidated in the token in the last 24 hours. This indicated huge profit booking in the short positions of the traders and the investors.
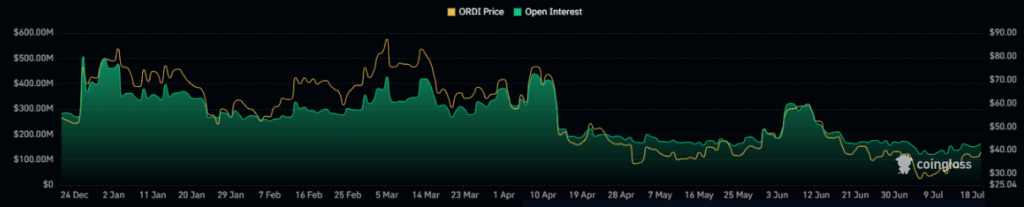
Ordinals Token Derivatives Open Interest Chart | Source: Coinglass
The open interest for the token has also advanced by 27% in the last 24 hours from the time of writing. This shows that the traders and investors add more positions.
The value of the derivatives traded volume for the token also advanced by 56% in the last 24 hours, resulting in a traded value of $1.03B.
ORDI Token Technical Analysis
For the past five months, ORDI has been confined within a falling wedge pattern, experiencing declines to new lows.
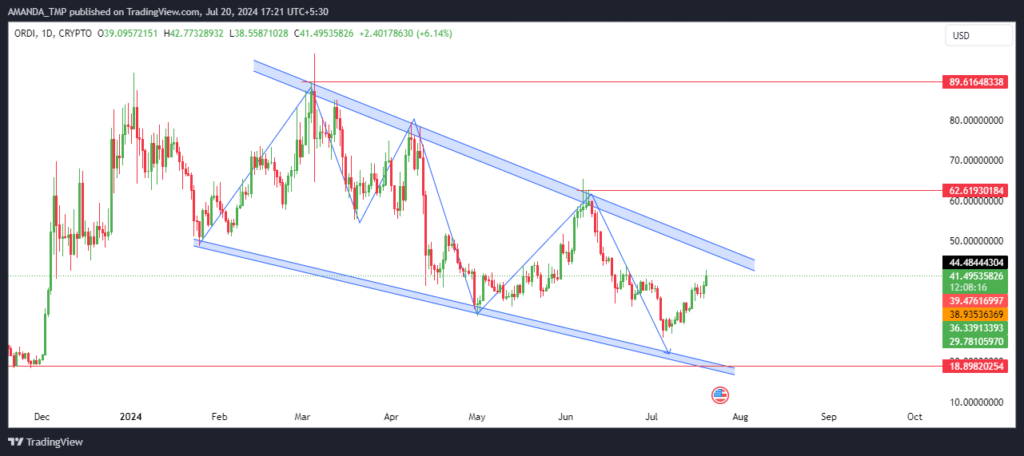
ORDI Token Daily Price Chart | Source: TradingView
The daily chart of ORDI reveals a consistently lower low structure, indicating a downward trend.
If the token’s price breaks above the falling wedge and sustains this position, particularly with a significant increase in trading volume, it could signal a strong uptrend.
Such a breakout would suggest the potential for a robust price rally in the future.
The ORDI token’s price has recently broken above the 50-day EMA while the 50-day and the 200-day EMAs are trading in a death cross. A golden cross might be seen if the token’s price continues to surge further.
ORDI/USD Chart by TradingView
The Supertrend further gives a bullish signal as the ATR level for the downtrend has been taken out.
The MACD indicator exhibits a neutral behavior as the MACD and the signal are trading in the negative territory.
RSI has advanced above the 50-level and is trading at 59 at press time. This shows a surge in the momentum of the price.
ORDI Indicating Bullish Potential
ORDI token shows strong bullish potential, trading 1350% above its all-time low and outperforming major cryptocurrencies.
With a 15% market cap increase in 24 hours, rising trading volume, and positive technical indicators, ORDI is poised for a significant price rally.
The support levels for the ORDI token price are $2.620 and $26.50, followed by the resistances of $62.60 and $89.00.
Disclaimer
This article is for informational purposes only and does not provide any financial, investment, or other advice. The author or any people mentioned in this article are not responsible for any financial loss that may occur from investing in or trading. Please do your research before making any financial decisions.




