
 streamoors
 Altai the Tiger
 Sword Inu
 IGNITION
 no crying in the casino
 Quantus
 Pearl
Pearl
- Bonk coin’s 74% supply has been unlocked, resulting in 68.83T BONK.
- Bonk coin has high liquidity based on its market cap.
The coin’s price has outperformed 96% of the top 100 crypto assets in the last 1 year. Additionally, the token’s price has advanced by 8800% in the last 1 year.
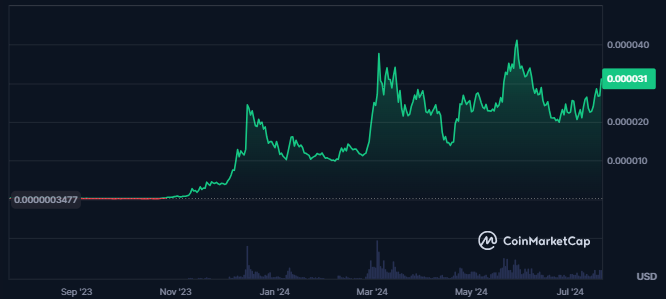
Price Overview Chart of BONK | Source: CoinMarketCap
The Bonk coin has huge liquidity as 26% of the market cap of the coin has been traded in the last 24 hours, resulting in a traded value of $561.422M. The token’s market cap has further advanced by 14.5% in the last 24 hours.
Bonk’s market cap ranking is #49 per CoinMarketCap, and its market cap value is $2.142B. Also, the market cap dominance of the token is 0.09%.
The supply inflation of the coin is high, resulting in 44.55%, while the circulating supply of the token is 68.877T BONK. Additionally, the token’s total supply is 92.913T, followed by a fully diluted market cap of $2.885B.
The Bonk coin’s sentiment has been bullish as the fear and greed index of the token is at 74, showing greed among the investors of the coin.
Bonk Coin Derivatives Data Analysis
The derivatives trading volume for the Bonk coin has advanced by 103% in the last 24 hours, resulting in a traded value of $177.65M.
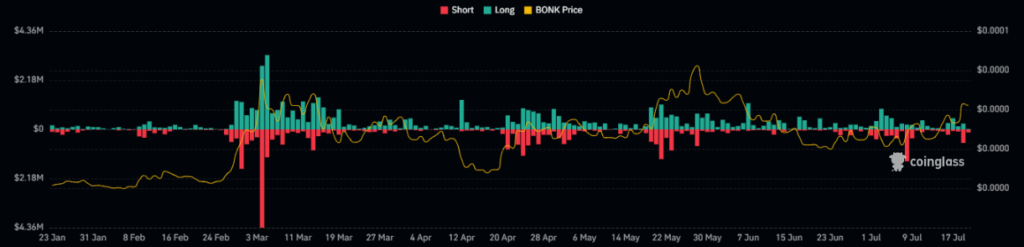
Bonk Coin Derivatives Liquidation Chart | Source: Coinglass
The open interest in the crypto has also advanced by 50% in the last 24 hours, showing the increase in the demand for the coin.
The liquidation chart of the coin further shows higher short liquidations in the coin in recent days. This shows the optimistic nature of the coin’s price.
Also, in the last 24 hours of at press time, the shorts worth $658.78K are liquidated, against which the longs worth $218.66K are liquidated.
BONK Coin Technical Analysis
The Bonk Coin has shown remarkable resilience, maintaining its position above a dynamic trendline for over five months. This trendline has consistently provided critical support, highlighting its significance in preserving price stability.
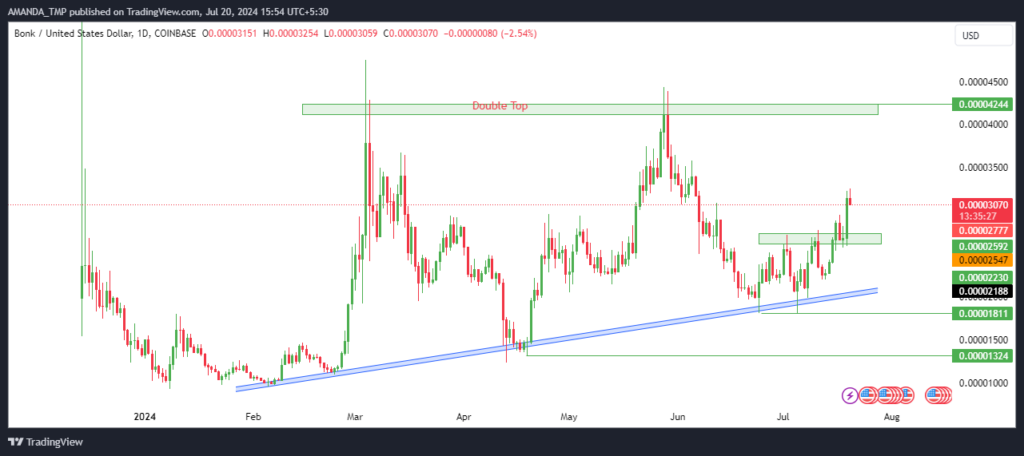
BONK Coin Daily Price Chart | Source: TradingView
The price chart displayed a double-top formation at higher levels, which initially caused a decline.
However, following this dip, the price again found support at the dynamic trendline and broke above the crucial resistance level.
At the time of writing, the cryptocurrency is experiencing buying pressure after rebounding from the dynamic trendline. This rebound has formed a bullish candlestick pattern, suggesting potential upward momentum.
BONK/USD by TradingView
A golden cross of the 20-day and the 50-day EMAs is formed on the daily chart of the BONK coin. The coin’s price has further broken above the following EMAs and has sustained above the same.
The MACD and the signal line have broken above the chart’s zero level, exhibiting a bullish character in the token’s trading price.
The RSI also has given a closing above the 50-level and is trading at a level of 61 at press time. The breakout of the RSI line above the 14-day SMA further followed this.
BONK exhibited strong Bullish Momentum
Bonk coin exhibited strong bullish momentum, outperforming 96% of the top 100 crypto assets with an 8800% gain over the last year.
High liquidity, significant market cap growth, and positive technical indicators like a bullish candlestick pattern and golden cross suggest a potential for new highs.
BONK coin price might take support at the levels of $0.00001320 and $0.0000180, followed by the resistance levels of $.0000420 and $0.0000550.
Disclaimer
This article is for informational purposes only and does not provide any financial, investment, or other advice. The author or any people mentioned in this article are not responsible for any financial loss that may occur from investing in or trading. Please do your research before making any financial decisions.




