
 Bitcoin
 Solana
 Pearl
Pearl Zerebro
 Aerodrome Finance
 LayerZero
 NEAR Protocol
- Bitcoin’s price follows a bullish momentum, leading to an advance in other crypto assets’ prices.
- A huge surge in the trading volume of the crypto assets is recorded.
Cryptocurrencies have increasingly become a prominent asset and investment option in recent years. As more traders and investors engage with the crypto market, numerous cryptocurrencies consistently outperform expectations each week.
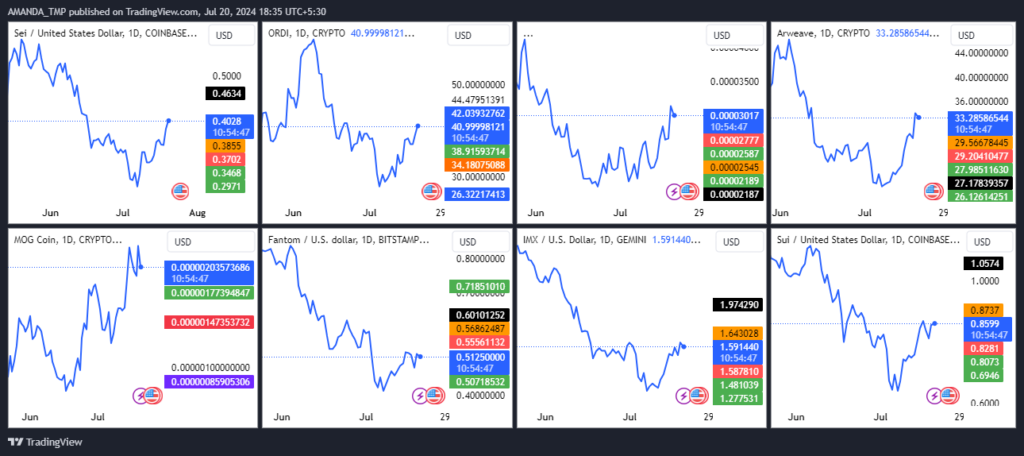
Top Cryptos Price Overview Chart | Source: Tradingview
In this analysis, we will review the top performers from the past week and examine the factors that could sustain their strong performance in the upcoming week. By understanding these trends, we can gain insights into the potential future movements of these digital assets.
SEI
The market cap of the SEI token has advanced by 13% in just the last 24 hours from the press time. It is the 78th largest cryptocurrency in the global crypto market and has a market cap of $859.029M.
SEI/USD Chart by TradingView on
The token’s price has broken out above a falling wedge pattern on the daily chart with strong volume. The following behavior of the token price shows a higher possibility of a further surge in the token price.
Ordinals
According to analysts, the token’s sentiment is neutral, while the Fear and Greed Index is at 74, indicating greed among investors. This suggests that buyers are willing to purchase the token at higher prices.
ORDI/USD Chart by TradingView
For the past five months, ORDI has been confined within a falling wedge pattern, resulting in declines to new lows. The daily chart of ORDI reveals a consistently lower low structure, indicating a persistent downward trend.
However, if the price of the token breaks above the falling wedge and sustains this position, particularly with a significant increase in trading volume, it could signal a strong uptrend. Such a breakout would suggest the potential for a robust price rally in the future.
BONK
The coin’s supply inflation is high at 44.55%, with a circulating supply of 68.877 trillion BONK. Additionally, the token’s total supply is 92.913 trillion, resulting in a fully diluted market cap of $2.885 Billion.
BONK/USD Chart by TradingView
The price chart recently displayed a double-top formation at higher levels, initially causing a decline. However, after this dip, the price found support at the dynamic trendline and subsequently broke above the crucial resistance level.
The cryptocurrency is experiencing buying pressure following its rebound from the dynamic trendline. This rebound has formed a bullish candlestick pattern, indicating potential upward momentum.
Arweave
In recent days, the market capitalization of the Arweave token has shown notable growth, reaching a peak of $2.08 Billion. This advancement has propelled Arweave to the 47th position on CoinMarketCap’s rankings.
The token currently holds a market presence of 0.09%, reflecting its significant standing in the cryptocurrency market.
AR/USD Chart by TradingView
Arweave (AR) has established a base at lower price levels and is now experiencing renewed buying interest. A significant level of change in character was identified around $30.50, which has recently been surpassed.
Should the token maintain its position above these higher levels, it could signal the beginning of a robust uptrend. Continued price stability at elevated levels may further bolster the potential for an upward market movement.
Mog Coin
The price volatility of the coin is notably high, currently at 26.57%. This elevated volatility could lead to unpredictable fluctuations in the trading price. Additionally, the fear and greed index remains neutral, indicating a state of uncertainty among investors and traders regarding the coin.
>MOG/USD Chart by TradingView
On the daily chart of Mog Coin, higher high swings can be seen, leading to a consistent price surge. The following behavior of the coin’s price has led to the formation of a rising pattern.
The coin recently broke above the wedge pattern with a strong surge in volume and momentum. Also, the price broke above its all-time high, forming a new ATH.
Fantom
The circulating supply stands at 2.803 billion FTM. This figure represents the number of active market tokens available for trading and transactions, which is crucial in determining market dynamics and liquidity.
FTM/USD Chart by TradingView
The daily chart of the FTM token reveals a consistent sell-off over the past few months. This persistent decline has led the token to form lower lows, underscoring a strong downtrend. The price has fallen below crucial support levels, and temporary support has been found at an unmitigated swing level.
Immutable
The market cap of the Immutable token has advanced by 4.0% in the last 24 hours from the press time. It is the 44th largest cryptocurrency and has a market cap of $2.448B.
IMX/USD Chart by TradingView
The price of the IMX token has witnessed consistent profit booking over the last few months, followed by a bearish character on the price action chart.
Despite the decline, the token’s price has witnessed consistent advances in recent days. A strong uptrend might be seen if the price further breaks above the resistances on the higher side.
SUI
Currently, 25.12% of the token’s maximum supply is in circulation, amounting to 2.512 billion SUI. The token’s total supply and maximum supply are set at 6.924 billion.
SUI/USD Chart by TradingView
Since the end of March 2024, SUI has undergone significant profit booking. It led to a steady decline in its price from a swing high of $2.1816 to a current trading price of $0.6898. This downward trend reflects a sustained period of market selling pressure and bearish sentiment.
The formation of lower lows on the daily chart further underscores the persistent bearish sentiment, signaling a continued downward trajectory. However, there are indicators that a potential reversal could be on the horizon.
Mantra
As of the latest update, the MANTRA token had 11.5K holders, all of whom acquired the token at lower prices and are currently in profit (“In the Money”). The top 10 holders collectively control 53.08% of the total supply, with the largest individual holder possessing 18.42%.
OM/USD Chart by TradingView
The OM token has experienced a consistent price surge, leading to the formation of a strong supply zone, which has now been broken. However, the price has not yet sustained above this zone, which is necessary to confirm the breakout.
Investors should wait for the price to break above the supply zone and close above it on the daily chart. If this breakout is confirmed, higher levels can be anticipated, driven by the previous bullish momentum and optimistic sentiment in the cryptocurrency market.
GALA
The volume/market cap of the GALA token is 9.61%, followed by a traded volume of $79.677M. This shows good liquidity in the token price, making buying and selling crypto easier.
GALA/USD Chart by TradingView
The GALA token’s price followed a strong downtrend. It formed a descending triangle pattern and a strong dynamic resistance level on the higher side.
If the token price further breaks above the dynamic resistance, it might lead to robust highs in the future.
Disclaimer
This article is for informational purposes only and does not provide any financial, investment, or other advice. The author or any people mentioned in this article are not responsible for any financial loss that may occur from investing in or trading. Please do your research before making any financial decisions.




