
 astronaut
 Zylo Ecosystem
 Pearl
Pearl Bitcoin
 Quantus
 Pudgy Penguins
 Bitway
- SEI token witnessed 9 green trading days in the last 30 days.
- The token had less than 29% of its total supply circulating in the market.
SEI token price witnessed a consistent decline over the last few months. Despite this strong decline, the token price was still up by 91% from last year’s low.
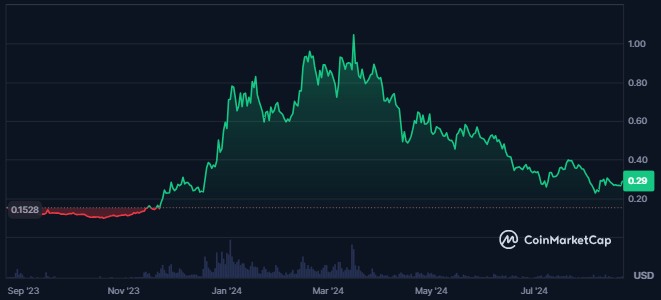
The supply inflation of the SEI token was very high, resulting in 62.50%, 3.30B SEI, and a total supply of 10.0B SEI. This further resulted in a fully diluted market cap of $2.873B.
A rise in the trading activity of the SEI token was witnessed, followed by a surge of 93% in the token’s trading volume. This resulted in a traded value of $93.871M, and the market cap advanced by 8.4%.
The SEI token’s market cap was worth $948.574M, making it the 69th largest cryptocurrency in the global crypto market. Also, the token had very good liquidity, resulting in a volume/market cap ratio of 9.6%.
The token’s price was highly volatile, resulting in a volatility of 14.37%, and the token’s market cap dominance was 0.04%.
SEI Token Derivatives Data Analysis
The token’s derivatives volume value advanced by 73% in just the last 24 hours from the press time. This resulted in a traded value of $123.42M, following which the open interest also advanced by 12.8%.
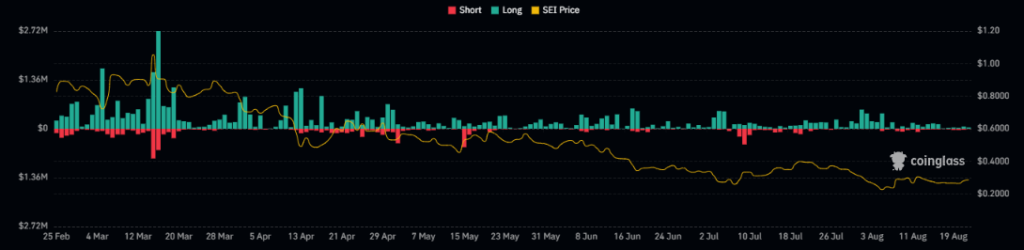
The SEI token price has shown a decline in liquidation activity in recent days. Additionally, higher longs were liquidated in the last 24 hours from the press time, resulting in a value of $84.23K. Also, shorts worth $84.23K were liquidated, showing the bear’s dominance in the token.
SEI Token Technical Analysis
The SEI token has been experiencing a persistent decline from its previous highs, forming a lower-low swing on the daily chart. This downward movement has been accompanied by a falling wedge pattern, indicating a strong bearish trend in the token’s price.
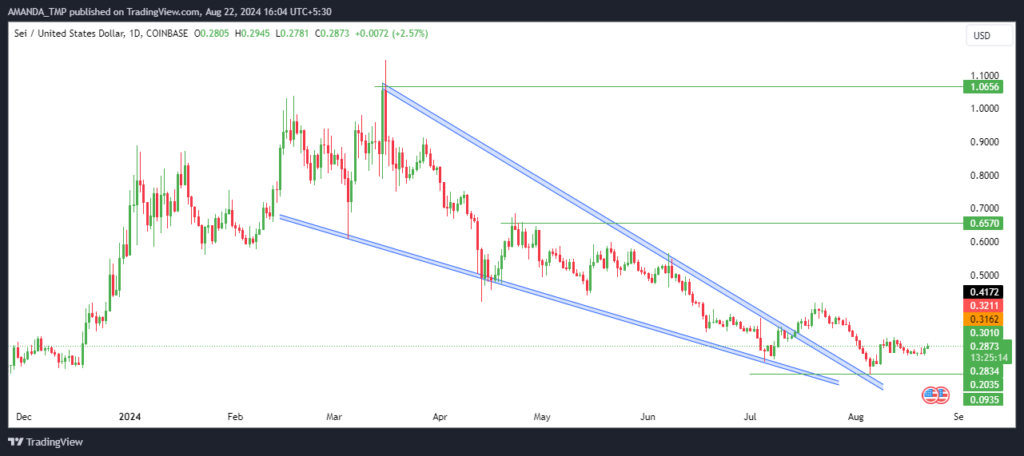
Previously, the SEI token had seen a significant rally, followed by a pronounced downtrend. The token reached a swing high of $1.1455 on March 16, 2024. However, it has since faced consistent profit-taking, leading to a steady decline.
Given the current price action, the SEI token appears poised to continue its downward trajectory, potentially testing lower support levels shortly.
SEI Token Technical Indicator Analysis
The SEI token’s technical indicators predominantly signal a bearish outlook, reinforcing the ongoing downtrend.
The 50-day and 200-day EMAs on the daily chart have been in a prolonged death crossover. This indicated sustained bearish pressure. The token’s price has declined below these EMAs, maintaining lower levels.
SEI/USD Chart by TradingView
The MACD and signal lines have remained in negative territory for an extended period despite forming a golden crossover. This crossover suggests a neutral stance in the token’s price movement, lacking strong bullish momentum.
Meanwhile, the RSI has followed a bearish cycle, encountering resistance at the 50 level before continuing its decline. Recently, the RSI entered the oversold zone, highlighting significant weakness in the token’s price.
Key support levels for the SEI token have been identified at $0.090 and $0.20. At the same time, resistance is expected at $0.650 and $1.060. These levels will be crucial in determining the token’s future price direction.
Disclaimer
This article is for informational purposes only and does not provide any financial, investment, or other advice. The author or any people mentioned in this article are not responsible for any financial loss that may occur from investing in or trading. Please do your research before making any financial decisions.




