
 Pearl
Pearl Bitway
 Pudgy Penguins
 Optimism
 Walrus
 NEAR Protocol
 Pons
Pons
- The ONDO Finance token had less than 14% of its total supply in circulation.
- The ONDO token price has been traded in green for only 11 days in the last 30 days.
Ondo Finance (ONDO) price was highly volatile, resulting in a volatility of 8.67%. The ONDO price traded in green and advanced by 260% in the last 1 year.
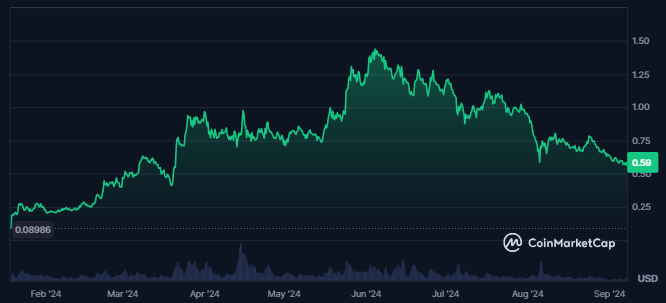
At press time, the ONDO token was the 70th largest cryptocurrency in the global crypto market. This resulted in a market cap of $814.61M, followed by a market cap dominance of 0.04%.
The ONDO crypto price sentiment was bearish, and the fear and greed index was 23. This showed extreme fear among the token’s investors.
The ONDO token witnessed a rise in trading activity as the token’s traded volume value advanced by 85% in the last 24 hours. This resulted in a traded value of $83.348M, which was 10.26% of the token’s market cap.
This showed strong liquidity in ONDO price, making buying or selling the token easier in different market conditions.
The Ondo Finance token was held by 62.6K addresses at press time, and its top 10 holders held 87% of the total supply. The number of token holders further consistently advanced over time, showing a rise in traders’ confidence.
Ondo Finance Witnesses Rise In Derivatives Trading Activity
The ONDO token experienced a significant surge of 80% in its traded volume in the last 24 hours. This resulted in a traded value of $183.11M, much higher than the token’s spot volume.
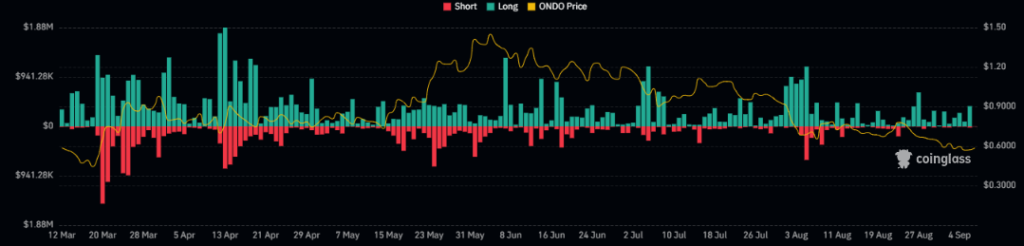
A rise in the token’s derivatives’ open positions was also recorded, followed by a surge of 3.0% in the open interest.
The Ondo crypto further witnessed a higher long liquidation of $376.00K, against which shorts worth $23.48K were liquidated. This showed the dominance of sellers in the token price, followed by a long/short ratio of 0.9099.
Where Are The Technicals Of the ONDO Token Taking The Price?
The ONDO price has traded in a strong downtrend. This was followed by a consistent price decline over the last three months. From the swing high of $1.48410, the token price declined by 60% and traded at $0.58667 at press time.
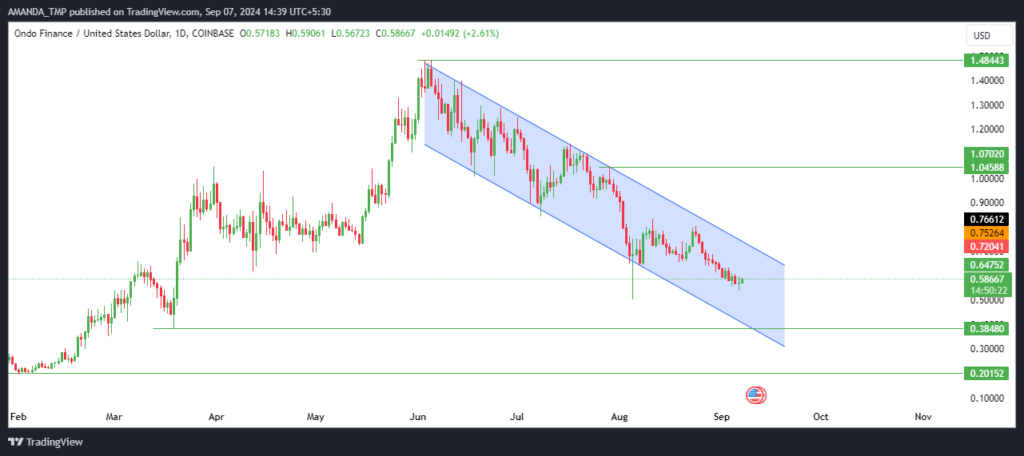
The following declining behavior of the ONDO price formed a falling wedge pattern. Suppose the token price breaks further above the falling wedge pattern and is sustained above the same. We might get to see higher levels in the future.
Let’s Dive Deep Into The Technical Indicators Of ONDO Token
The ONDO token price traded below the 50-day and the 200-day EMAs for a long time. It also recently took resistance from the 200-day EMA and continued to decline to lower levels.
ONDO/USD Chart by TradingView.com
The Supertrend also gave a strong sell signal on the chart. This is because the ONDO price traded below the Average True Range Level of the indicator.
The MACD indicator showed volatility in price as the MACD and the signal line overlapped each other. The following metrics further traded in the negative trajectory.
Additionally, the RSI declined to the lower levels and traded at 35.3. This showed bearish momentum in the token price and the RSI trade below the 14-day SMA.
The ONDO crypto price might take support at $0.20 and $0.380. It was followed by the resistance levels of $1.040 and $1.480.
Disclaimer
This article is for informational purposes only and does not provide any financial, investment, or other advice. The author or any people mentioned in this article are not responsible for any financial loss that may occur from investing in or trading. Please do your research before making any financial decisions.




