
 streamoors
 IGNITION
 no crying in the casino
 Sword Inu
 Altai the Tiger
 NEAR Protocol
 Quantus
- BEAM token was one of the largest losers of the previous week.
- Most cryptocurrencies have witnessed profit booking in the recent few days.
This week, the cryptocurrency market experienced significant profit-taking, leading to a widespread price decline. As a result, many cryptocurrencies have seen sharp losses, with several now trading at discounted levels.
Given these market conditions, it is crucial to analyze the top crypto losers of the week. Understanding their price movements and evaluating their potential for recovery in the coming days will offer valuable insights into the broader market.
1. BEAM
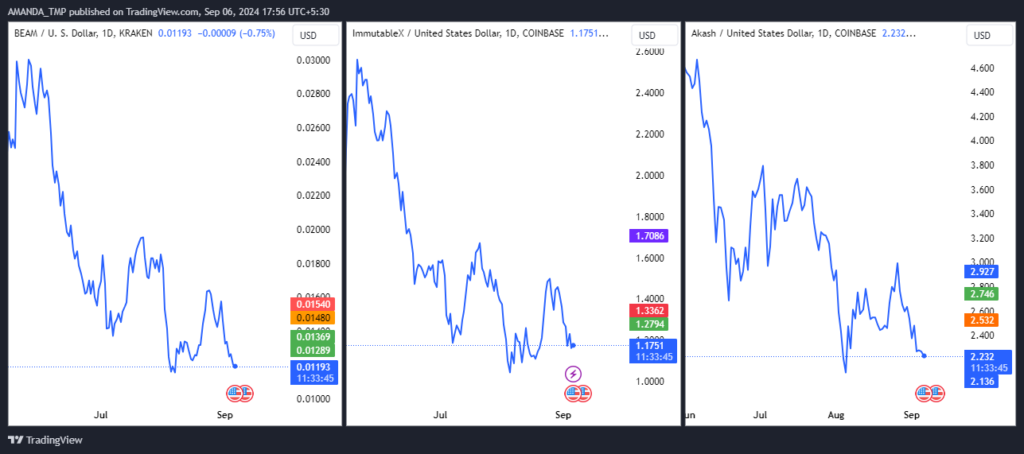
The Beam (BEAM) token witnessed a slight decline of 2.1% in its market cap in the last 24 hours. The token’s market cap is valued at $594.356M, resulting in a market cap ranking of #91.
BEAM/USD Chart by TradingView
The BEAM crypto has been locked in a pronounced downtrend, consistently forming lower lows on the daily chart. This pattern reflects the strong bearish pressure that has dominated its market performance. It indicated a continuation of the downward trajectory.
Any potential rebound in BEAM’s price is likely to face significant resistance. It could trigger a liquidity grab and drive the price back to previous lows. The recent breaches of critical support levels have further reinforced the possibility of continued downward momentum in the short term.
2. Immutable
The Immutable (IMX) token’s supply inflation was very high, resulting in 31.97%. Moreover, the IMX’s market presence was also strong, resulting in 0.09%.
The token’s sentiment was bearish, and the fear and greed index was at 22, showing extreme fear among investors. This led to profit booking at the IMX price.
IMX/USD Chart by TradingView
The IMX coin has been caught in a persistent downtrend over the past five months, with its price continually descending to new lows. This extended bearish phase has resulted in lower lows on the price chart, highlighting the sustained dominance of sellers in the market.
The IMX token has formed a falling wedge pattern during this downward trajectory. This is often considered a bearish continuation signal, reflecting the ongoing downward momentum.
However, falling wedges are also recognized for their potential to signal a reversal if certain conditions are met.
3. Akash Network
Akash Network (AKT) token’s market cap ranking was #96 in the global crypto market. The token’s liquidity declined recently, resulting in a volume/market cap ratio of 1.02%.
The AKT token had only 832 holding addresses at press time, and its security score was 83.13. The token further belonged to the A tier with a global security ranking of $452.
AKT/USD Chart by TradingView
A larger timeframe analysis of the AKT crypto reveals a strong and sustained uptrend. It was accompanied by the price showing bullish momentum over the past year. This consistent upward movement reflects positive market sentiment and increasing investor confidence.
However, the AKT price recently experienced profit-taking from its elevated levels, resulting in a decline towards the $1.80 mark. Despite this pullback, the price has found support at these lower levels, forming a higher high swing. This pattern often signals a potential reversal, suggesting the uptrend could resume.
Disclaimer
This article is for informational purposes only and does not provide any financial, investment, or other advice. The author or any people mentioned in this article are not responsible for any financial loss that may occur from investing in or trading. Please do your research before making any financial decisions.




