
 Bitcoin
 Pearl
Pearl Starknet
 Zerebro
 NEAR Protocol
 Solana
 Quantus
- The Mantra token price traded 5500% above its all-time low price.
- OM token’s price volatility was medium, resulting in 4.79% showing stability in price.
Mantra (OM) price advanced by 5200% in the last 1 year. Additionally, it outperformed 97% of the top 100 crypto assets in the previous 1 year.
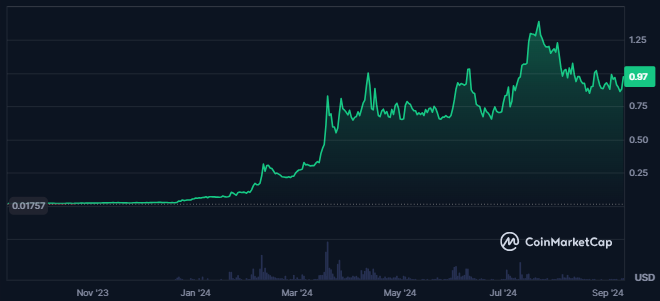
The OM price has advanced by 8.7% in the last 24 hours compared to press time. This resulted in a market cap value of $819.70M, making it the 75th largest cryptocurrency in the global crypto market.
Being one of the top 100 crypto assets, the OM crypto had a market cap dominance of 0.04%. Despite this, the token’s supply inflation was very high, at 67.44%.
At press time, the Mantra token’s price sentiment was bullish, while the fear and greed index showed fear among investors. The token’s spot traded volume also advanced by 50% in the last 24 hours. This resulted in a traded value of $21.315M, which was just 2.68% of its market.
OM coin price also witnessed a surge of 64% in its derivatives traded volume, resulting in a value of $58.15M. The open interest also saw an advance of 4.7%, showing a rise in the open position of derivatives.
What Do Finances of the Mantra Token Indicate About Price?
The IntoTheBlock data of OM crypto showed that 82% of its total holders were in profit. Additionally, the token had a total of 13K holders.
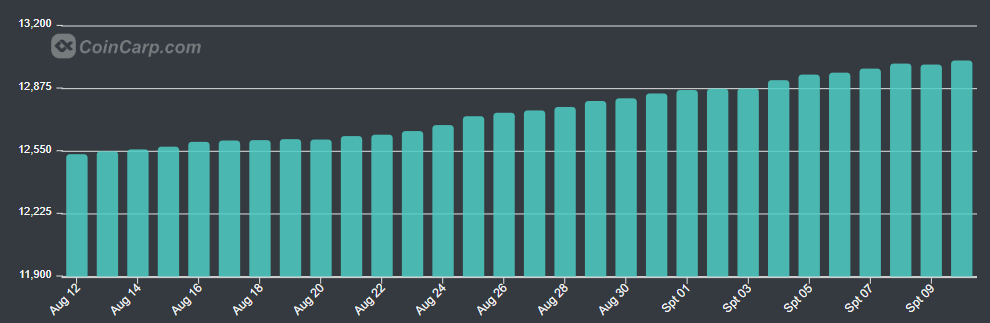
The holder’s overview chart of the Mantra token showed a consistent rise in the token holders. Also, the token’s top 10 holders held 51% of the total supply.
The large holder’s concentration in the token was 94%, and 43% of its total holders held it for more than 1 year. The OM coin price correlation with Bitcoin was certainly low, resulting in 0.33.
The OM token’s security score was 84.16, leading it to tier A, representing its protocol strength. Also, the token’s global security ranking was #376 at press time.
OM Token’s Price Struggling To Break Above Crucial Levels
The overall price structure of the OM price was bullish, as the token price traded at much higher levels than its all-time low.
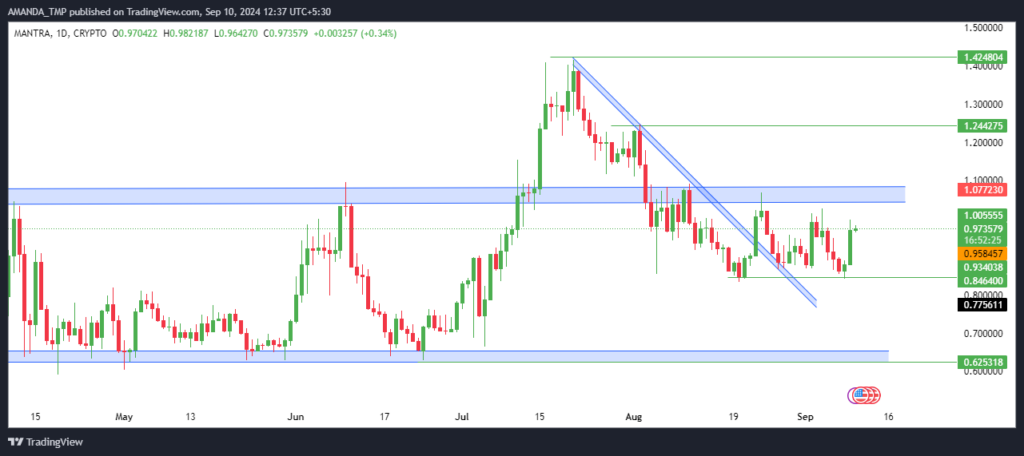
Looking into the most recent price action, the token’s price witnessed profit booking from the swing high of $1.415921. The OM price has been traded 40% lower than the swing high.
The following decline in price led to small consolidation, and the price struggled to break out above the same. Additionally, the consolidation range was formed just a month ago.
Suppose the OM crypto price breaks above the consolidation range with a strong surge in volume. If this happens, it might lead to higher levels following a continuation of an uptrend.
What Does OM Token Technical Indicators Exhibit About The Price?
The OM price daily chart EMAs showed a rising trend, followed by an existing uptrend in price. The 50-day and the 200-day EMAs also traded in a golden cross, and the token price also broke out above the 50-level.
OM/USD Chart by TradingView
The MACD indicator showed a neutral behavior as the MACD and the signal line traded in golden cross. Following this, the metrics traded in the negative trajectory, and bullish histograms were formed on the chart.
The RSI broke above the 50-level and sustained above the same. It also broke out above the 14-day SMA and traded at a level of 53.6.
The OM price might take support at $0.6250 and $0.8460, while the resistance levels for the token were $1.240 and $1.420.
Disclaimer
This article is for informational purposes only and does not provide any financial, investment, or other advice. The author or any people mentioned in this article are not responsible for any financial loss that may occur from investing in or trading. Please do your research before making any financial decisions.




