
 streamoors
 Injective
 Pudgy Penguins
 Celestia
 Pearl
Pearl Sui
Sui Bitcoin
- The high concentration of whales and investors holding GALA suggests potential long-term confidence.
- The current bearish trend and potential challenges from technical indicators could hinder price recovery.
- While the GALA price faces challenges, its on-chain fundamentals and potential technical indicators suggest a possible rebound.
Gala (GALA) price performance was strong until early March 2024, peaking at $0.086279. However, it struggled to maintain these gains, with the bullish trend failing and the price forming lower lows amid a declining trendline.
Efforts to sustain gains were evident as the GALA price formed a support level at $0.0384 following a liquidity grab on April 13, 2024. For nearly two months, the price consolidated within a Darvas box range in an attempt to surge.
On June 7, 2024, the support was lost following a significant sell-off from the upper boundary of a wedge formation. It coincided with the 50-day and 200-day EMA bands.
The breakdown of the Darvas box indicated a loss of critical support for the bulls. This resulted in a sharp decline of over 75% from the ATH of 2024, as the price fell within a narrowing wedge.
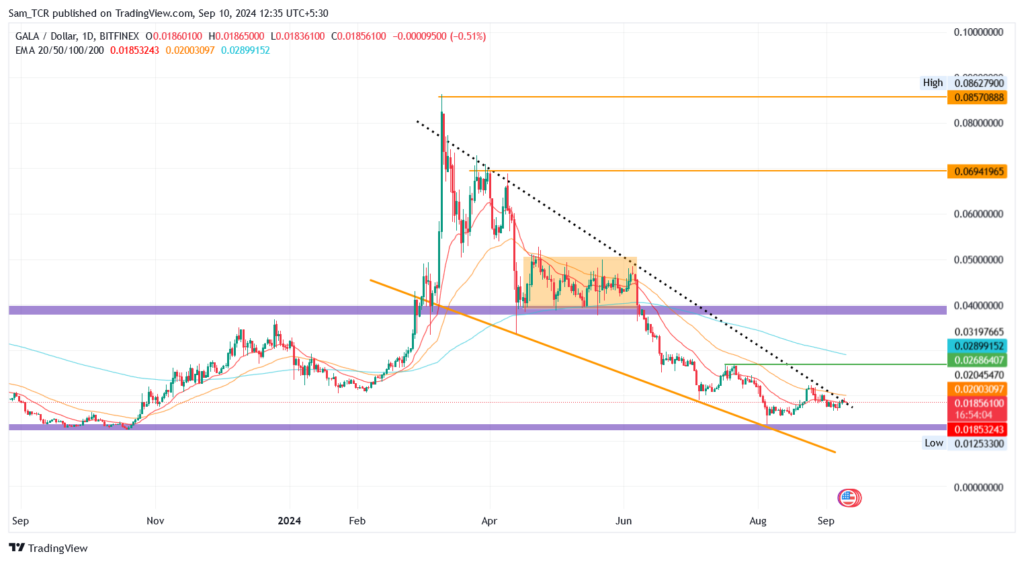
As of this writing, the GALA crypto price has formed a dynamic falling wedge. A critical level to watch is $0.02686, which could be pivotal for a potential rebound and Change of Character (CHoCH).
Can GALA Turn Bullish?
Despite these challenges, the GALA chart displayed a liquidity grab on August 5, 2024, at a dual support zone. This aligns with the historical demand zone and the lower border of the dynamic wedge.
Regardless of the attempt to rise, the bears remained dominant and kept the price beneath the wedge’s upper border. The GALA crypto increase last month remained at only 40%.
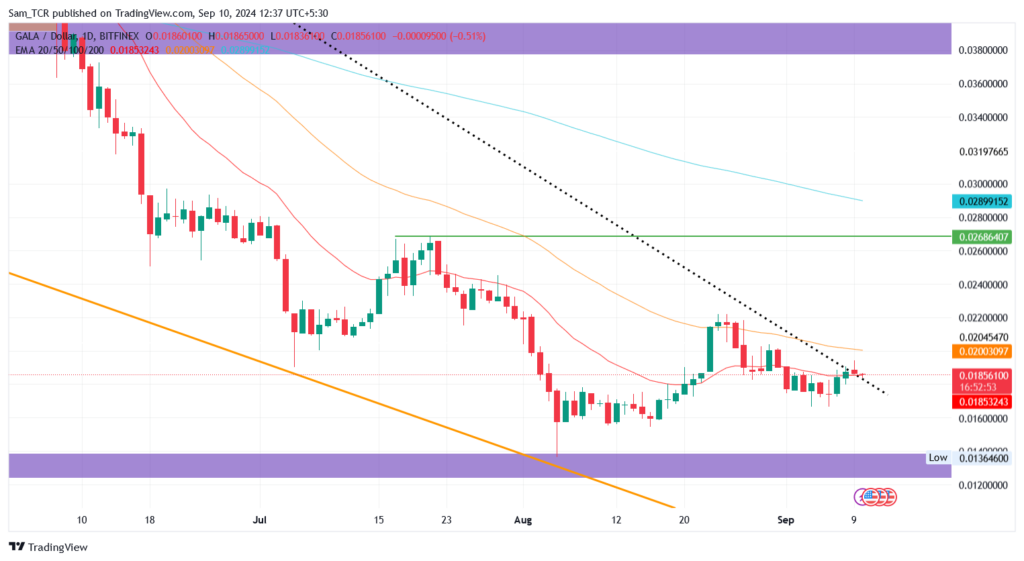
The 20-day and 50-day EMA bands posed significant obstacles that could impede further gains. However, once it pierces them, the situation might flip.
When writing, the price has traded near $0.01853 with an intraday dip of 1.37%. GALA’s market capitalization has declined by 0.56% in the past day, which was $640.21 Million. It has ranked among the top 100 cryptos on CoinMarketCap in terms of market cap.
The trading volume of GALA crypto was $67.749 Million in the last 24 hours. The surge reflected a 33.85% surge from the previous intraday session.
On-chain Data Of GALA
Per the on-chain, the number of holder’s addresses with GALA balances is 258.87K. The average time the token was held was nearly 2.3 years before it was transferred.
The holding pattern showed a higher concentration of investors and whales, and retail holding is minimal. The whales and investors had a combined concentration of 84%, while retail holdings were only 16%.
The token has witnessed losses and negative price performance in the last 6 months. Despite this, the addresses have higher beliefs about future GALA price optimism per the holding pattern.
Per the current financial data, 93.58% of the holders were in loss, and 1.51% were at break even. The only green portfolio was 4.91% of the total addresses.
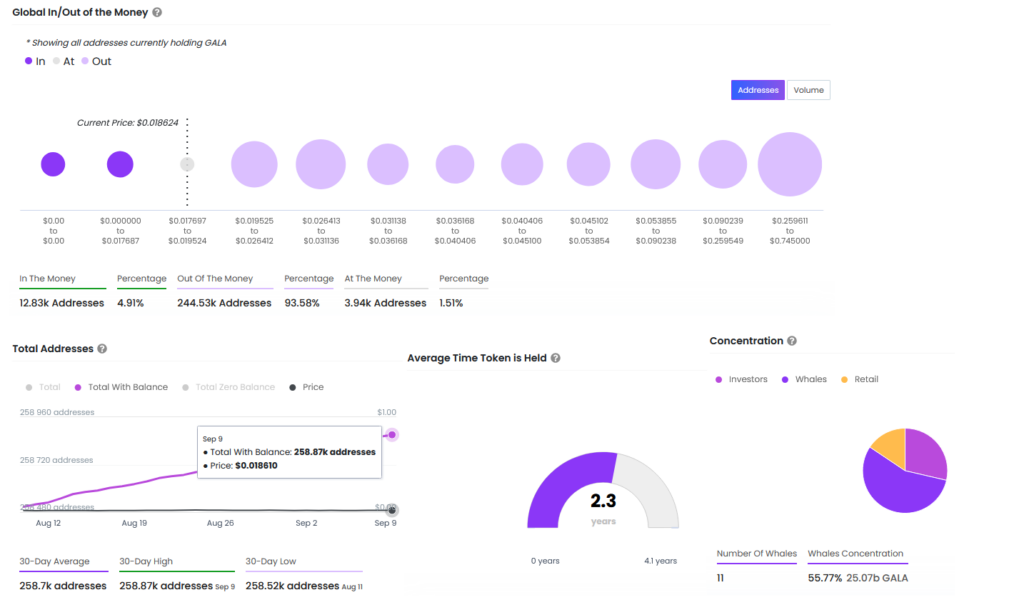
This data overall highlighted that the GALA crypto holders are not squaring off their losing positions and are willing to hold. This optimism highlighted the chances that GALA might invite more buyers’ accumulation, leading to a price surge.
Indicators of GALA
MACD remained in the bearish territory with a slight bullish cross. The MACD line was at -0.00022553, and the histogram was at 0.00005522.
RSI stood at 49.64, closer to the median of 50. However, it indicated recovery from oversold conditions. It hinted at possible opportunities for a rebound.
Levels To Watch For
Per the GALA price prediction, support levels were at $0.012533 and $0.016055. On the other hand, resistance levels were at $0.026864 and $0.038141.
Disclaimer
In this article, the views, and opinions stated by the author, or any people named are for informational purposes only, and they don’t establish the investment, financial, or any other advice. Trading or investing in cryptocurrency assets comes with a risk of financial loss.




