
 astronaut
 Walrus
 Pearl
Pearl Bitcoin
 NEAR Protocol
 Zcash
Zcash Hyperliquid
- The increase in address activity and transaction volume suggests a potential price rebound.
- Derivatives market indicators point toward a bullish sentiment for QNT price.
- The broader crypto market showed signs of recovery, which could benefit QNT.
Quant (QNT) crypto has acquired attention with a remarkable price surge, pushing its value above $75. This week’s strong momentum has effortlessly propelled QNT past the 20-day and 50-day EMA bands.
In the past day, the QNT price has surged by an impressive 9%. This spike was driven by Bitcoin‘s (BTC) recent move to $58,000 intraday. Despite BTC encountering slight turbulence at the $58K level, Quant crypto continued accelerating, emerging as one of the day’s top gainers.
The global crypto market cap saw a slight increase of 0.14% to $2.04 Trillion. However, the total market volume dropped by 15% to $61.34 Billion.
Keep reading for more insights on whether the QNT price will continue to rise despite broader market turbulence.
QNT Price Attracted Attention With Rise In Addresses Activity
The cryptocurrency market is recovering, with projects like Quant gaining attention. The token has seen a significant increase in address activity. This suggested a potential Quant price rebound.
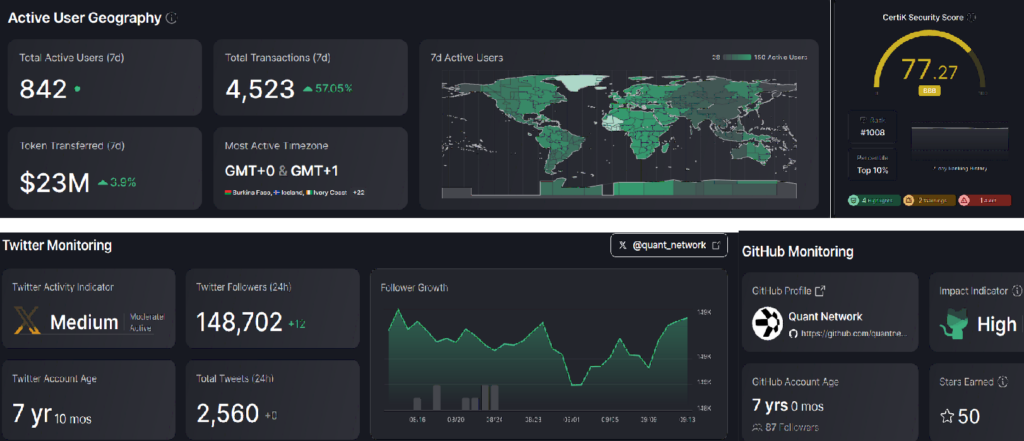
Similarly, the total transaction count has surged by 57.05% this week, reaching 4,523. This week, the token transfer volume amounted to $23 Million, involving 842 active users.
This uptick in activity indicates that Quant might be preparing for a more substantial market move.
Historically, such increases in wallet activity during market downturns often precede price recoveries. This makes QNT worth monitoring.
According to CoinMarketCap, with an intraday surge, most metrics turned green. Quant cryptos’ market cap has risen above $920.46 Million, ranking it the 68th-largest crypto asset. Its daily spot trading volume has also increased to approximately $16.72 Million, reflecting strong market interest.
Looking at its fundamentals, Quant Crypto has a robust presence on X (formerly Twitter) with 148.702K followers. It has gained 12 new followers in the past 24 hours.
The X account is 7 years and 11 months old and has posted 2,560 times. This highlighted its long-standing presence in the crypto community.
Quant’s GitHub account, also over seven years old, has received 50 stars from the developer community. The project has a security score of 77.27 and a BBB tier rating.
A Detailed Analysis of QNT Crypto’s Derivative Market
According to Coinglass, QNT’s OI-weighted funding rates have risen to 0.0098% positive, indicating a shift in market sentiment towards optimism. Traders have bet on the increased potential for the QNT price to rise.
Similarly, QNT’s open interest reached $21.80 Million, marking a 39.89% increase from the previous session. The 24-hour long/short ratio stood at 0.9861, showing more short positions than long ones.
In the last 24 hours, $50.42K worth of short positions were opened, while no long positions were liquidated intraday. This scenario suggested a positive outlook for Quant crypto in the market.
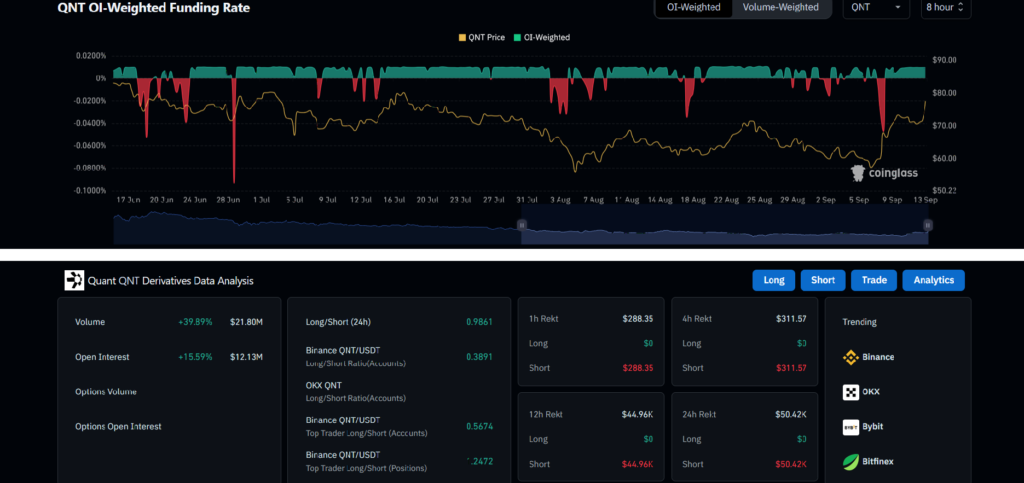
These metrics highlighted a strong bullish sentiment for QNT, confirming the recent intraday price surge. The increase in open contracts and higher short-side liquidations suggest that the QNT price could continue to rise.
Additionally, derivatives volume surged by 15.59%, bringing the total traded value to $12.13 Million. This increase reflected the growing demand for QNT crypto in the derivatives market.
Quant Price Prediction
After reaching a peak of $150 in the first quarter of 2024, the QNT price fell sharply. This dropped to $50 by August 5th.
However, on the same day, a sudden surge in buying created a liquidity wick. It pushed the price up in the last month of the third quarter, resulting in a breakout from a long-term falling wedge pattern.
This week’s and intraday performance have been particularly strong. The daily Quant price chart reveals a double bottom pattern around the $60 horizontal support area. The price appears to be accelerating toward $91 in the short term.
If the bullish momentum continues, it could break through the dynamic trendline. This could also reach $150 by the end of October.
Disclaimer
This article is for informational purposes only and does not provide any financial, investment, or other advice. The author or any people mentioned in this article are not responsible for any financial loss that may occur from investing in or trading. Please do your research before making any financial decisions.




