
 astronaut
 Pearl
Pearl Zylo Ecosystem
 Bitcoin
 Bitway
 NEAR Protocol
 Zcash
Zcash
- Ethereum coin’s major holders were in profit at the time of writing.
- The ETH coin price advanced by 41% in the last 1 year.
Ethereum (ETH) recently hit the ground below the crucial trendline. The downtrend signaled a potential breakout. However, the ETH price has been trying to sustain itself at lower levels despite this.
Join us to find out what the metrics are saying, whether this is a genuine decline or a temporary dip.
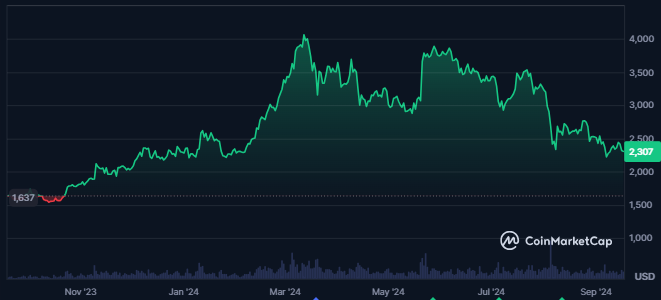
At press time, the Ethereum coin had 347.711 million holders. It reflected a consistent increase in holding addresses. This surge indicated growing confidence among investors, with 74% of all holders having maintained their positions for over a year. Ethereum has continued to demonstrate its strong market presence.
With a market capitalization of $278.137 Billion, Ethereum commands a market cap dominance of 136.53%. Despite its current standing, the ETH price has grown significantly. It advanced by an impressive 548,700% from its all-time low of $0.4209, set nine years ago.
However, the coin is still down 52.7% from its all-time high of $4,891, reflecting the broader volatility in the crypto market.
In the past 24 hours, ETH crypto’s market cap saw a slight decline of 0.20%, highlighting some recent fluctuations in value. Despite this, the coin’s traded volume reached $13.741 Billion. This resulted in a volume-to-market cap ratio of 4.94%, signifying robust trading activity within the market.
Examining Ethereum Coin’s Derivatives Data
The derivatives trading volume of Ethereum declined by 24% in the past 24 hours, dropping to $18.27 Billion. Similarly, the token’s options volume saw a 35% decrease, indicating a reduction in trader engagement with the coin. These declines reflect waning interest in Ethereum’s derivatives market over the short term.
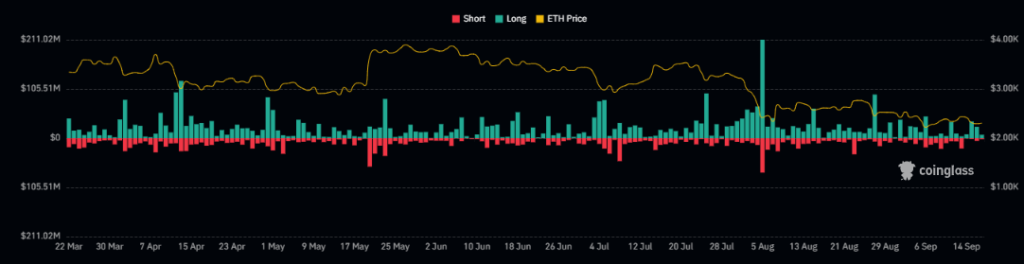
Despite this, Ethereum recorded a slight increase in open positions, with open interest rising by 0.88%. This brought the total open interest value to $10.75 Billion, suggesting that some traders are still actively maintaining positions despite the overall decline in volume.
Additionally, Ethereum experienced significant long liquidations, with $20.10 million worth of positions closed in the last 24 hours. Short liquidations totaled $5.19 Million, further highlighting seller dominance.
What the Technicals of Ethereum Coin Indicate
Ethereum has been trading in a strong downtrend over the past few days, with its price declining by 30% from its most recent swing high. This downward movement brought the price to the higher band of a falling wedge pattern, a formation often associated with a potential reversal.
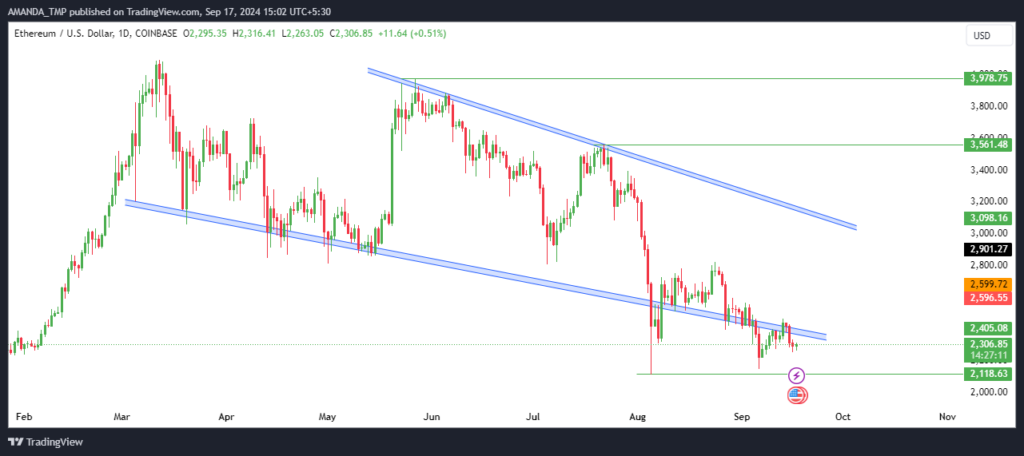
At press time, ETH touched the lower band of this falling wedge, where a strong bullish candle formed, indicating renewed buyer interest at lower price levels. This suggests that market participants may be entering positions, anticipating a potential shift in momentum.
If the Ethereum price gains strength and successfully breaks above the falling wedge pattern, it could signal the start of a bullish trend. In such a scenario, the price might aim for the most recent swing high of $2,800.
A breakout above this level could trigger a rally toward the upper band of the pattern, offering a promising opportunity for traders to capitalize on short-term price momentum.
What Technical Indicators Indicate For ETH
The 50-day and 200-day exponential moving averages (EMAs) have recently formed a death cross, signaling bearish momentum. Following this, the Ethereum price declined below both EMAs and has continued to trade beneath them, reinforcing the downward pressure on the token.
ETH/USD Chart By TradingView
Additionally, the Moving Average Convergence Divergence (MACD) and its signal line have overlapped, with both metrics trending negatively, further indicating weakness in the price action. The Relative Strength Index (RSI) also faced resistance at the 50-level and subsequently fell below the 14-day Simple Moving Average (SMA), underscoring the lack of bullish strength.
Ethereum may find support at $1,535 and $2,110, providing potential price stability. On the upside, resistance levels are anticipated at $3,560 and $3,970, which will be key areas to watch if the token attempts a recovery.
Disclaimer
This article is for informational purposes only and does not provide any financial, investment, or other advice. The author or any people mentioned in this article are not responsible for any financial loss that may occur from investing in or trading. Please do your research before making any financial decisions.




