astronaut
 Pearl
Pearl Zylo Ecosystem
 Bitcoin
 Bitway
 NEAR Protocol
 Zcash
Zcash
- MOG crypto price approached the critical resistance zone of $0.0000002100.
- A rounding bottom pattern was observed, suggesting a bullish rally ahead.
While the broader crypto market faced a sideways trend, Mog Coin (MOG) has continued to extend gains. This week, it reached the critical resistance barrier of $0.000002100 and aimed for a breakout.
A rounding bottom pattern was noted, and the memecoin tried to breach the horizontal neckline for a bullish breakthrough. Currently, MOG price stays above the significant moving averages and looks bullish on the chart.
What Do Crypto Analysts Say On Mog Coin?
In a recent tweet, Montblanc said that Mog Coin has strong fundamentals and doesn’t go down. The long-term bullish trend was intact, and MOG crypto was the greatest memecoin ever.
Going forward, Dr Dinero, on X, shared his optimistic view. He said the MOG price was consolidating near the ATH region and looked promising on the chart. A breakthrough above the ATH resistance level would trigger fresh higher levels ahead.
Per the Fib levels, the MOG price was inching closer to the 61.8% level and near the upper Bollinger band.
MOG Price Prediction: Analyzing The Key Levels
Mogcoin price prediction on a daily time frame indicates a bullish bias. It rests above the key EMAs and anticipates a breakout in the short term.
Mog coin was trading at $0.000002053, noting a decline of over 2.30% over the past 24 hours. However, it has attained weekly gains of over 18% and depicts a bullish trend. It boasted a market cap of $801.89 Million and has a circulating supply of 390.57 trillion.
An increase in On-Balance Volume (OBV) typically indicates a price demand as it measures demand and supply.
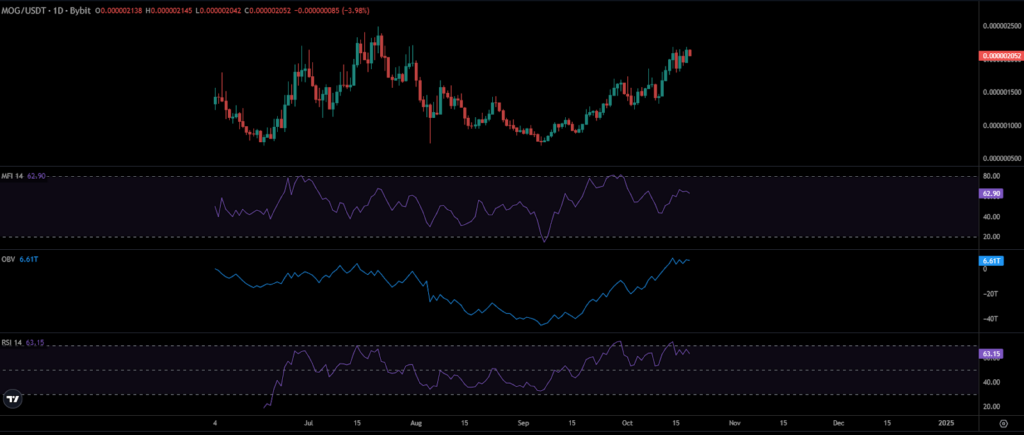
However, in Mog coin’s case, the high OBV reading suggested accumulation was happening. This indicated a potential for an accelerated uptrend. Also, the Relative Strength Index (RSI) line stays around the 60 mark, signifying a bullish momentum on the chart.
Moreover, the Money Flow Index (MFI) surged to 62. Generally, values above the 50 mark hint at the rising inflows in the market.
Social Metrics Pivots Bullish Optimism
Data from Messari highlighted that the bullish trend of MOG prices was buzzing on social media platforms.
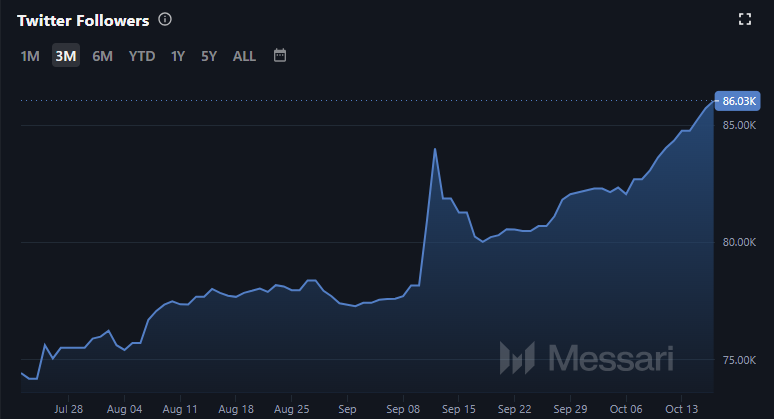
Since September 2024, the number of users on the X platform has surged massively. In the last two months, the count of followers increased from 80k to 86k, noting increased speculation.
Futures Market Data Outlook
In addition to the bullish trend, the OI-weighted funding rate remained positive at around 0.2166%. This conveyed the sustained demand for long positions.
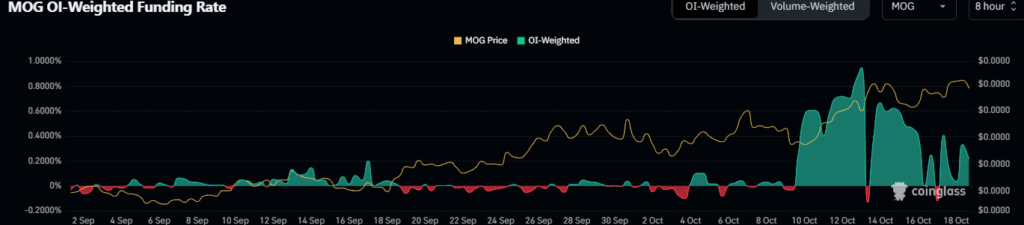
However, the Open Interest (OI) rose 16.60% to $380.29k. This represented a short addition over the past 24 hours. This meant that bears were trying to secure the region. They were willing to push the altcoin from the highs.
The immediate support zones for MOG crypto were $0.000002000 and $0.000001920. At the same time, the upside hurdles were $0.000002120 and $0.000002320.
Disclaimer
This article is for informational purposes only and does not provide any financial, investment, or other advice. The author or any people mentioned in this article are not responsible for any financial loss that may occur from investing in or trading. Please do your research before making any financial decisions.