NEAR Protocol
 Bitcoin
 Aerodrome Finance
 Pearl
Pearl Uniswap
 Quantus
 Pudgy Penguins
- The GALA price rallied over 20% this week, displaying bulls’ strength.
- Analysts guide a bullish stance on GALA, suggesting a rally ahead.
Gala (GALA) token witnessed outperformance and soared over 20% in the last three sessions. It approached the 100-day EMA barrier and was trying for a breakthrough above $0.02300.
For the last few sessions, the GALA token price witnessed retracement and remanded in a narrow range. However, it took support around $0.01700 and rebounded toward the 100-day EMA mark.
Follow-on buying momentum was established this week, and market participants anticipated a breakout move. A daily close above the $0.02300 mark would confirm the breakout. This may push the GALA token toward the 200-day EMA, close to $0.02550.
GALA Price At Press Time
The GALA price traded at $0.02161 at press time. The token noted an intraday rise of over 2.10%. It boasted a market cap of $762.55 Million and has a total supply of 37.40 Billion. The pair of GALA/BTC was at 0.000000283 and ranked 90th among the top crypto coins.
Where to Buy and Sell? Analyst Revealed Key Levels
Analyst CW8900, in his recent X post, said that GALA crypto has traded in the accumulation zone. It reached the upper end of the triangle convergence pattern.
$GALA is currently in the accumulation zone. It has also reached the upper line of the triangle convergence pattern that has been in place since March.
— CW (@CW8900) November 8, 2024
Volatility is likely to occur soon. If it breaks out of that convergence and out of the accumulation zone, a real bull rally… pic.twitter.com/c6qwkefX79
A bullish rally would trigger if it breaks out of the convergence pattern. However, significant volatility will be seen in the coming sessions. In his tweet, Crypto Nuclear highlighted that the GALA price has bounced off the support block. It represented an excellent buy setup.
$GALA ~ 1W ✅$GALA This is the support block that has been holding the price from falling lower.
— Crypto Nuclear (@crypto_nuclear) November 5, 2024
If you still have Conviction on this coin. do the buying in stages here. With a minimum target of 20%++. This is a very good buy with lower risk.
Join our telegram channel for… pic.twitter.com/iLy8f9onNM
Per the Fib levels, the GALA price has sustained above the 50% zone and targets to cross the 61.8% level. A short covering move would trigger once GALA crypto climbs above the 100-day EMA mark. This may send GALA toward the $0.02500 level ahead.
GALA Price Action Analysis: What Does the Chart Suggest?
GALA price prediction represented a bullish bias. It was trying to cross the 100-day EMA barrier and displaying buyer accumulation.
The latest bounce from the $0.01700 levels displayed the bulls’ strength and anticipation to register a breakout. However, the present hurdle of $0.02300 was still challenging for the bulls.
The Relative Strength Index (RSI) line stayed close to the midline region, around 52, representing a neutral outlook. However, the Moving Average Convergence Divergence (MACD) indicator began to plot the green histogram reading. That depicted a bullish outlook.
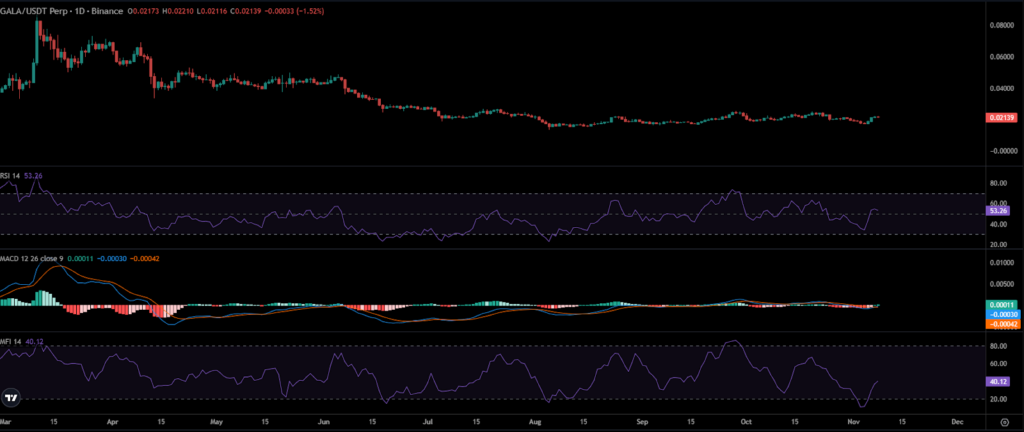
Meanwhile, the Money Flow Index (MFI) reading was below 50. This signified a lack of inflows in the market. Furthermore, the Futures Market Data represented a bullish outlook.
This happened as the OI-weighted funding rate represents a demand for long contracts. At press, the funding rate was noted to be 0.0126%.
The Open Interest (OI) has risen over 1.98% to $66.05 Million over the past 24 hours, conveying a prolonged buildup activity. The immediate support zones for GALA crypto were $0.02100 and $0.02000. At the same time, the resistance levels were $0.02300 and $0.02450.
Disclaimer
In this article, the views, and opinions stated by the author, or any people named are for informational purposes only, and they don’t establish the investment, financial, or any other advice. Trading or investing in cryptocurrency assets comes with a risk of financial loss.