
 Bitcoin
 Pearl
Pearl Starknet
 Zerebro
 NEAR Protocol
 Solana
 Quantus
- The BRETT price has surged over 165% within the last two weeks.
- Momentum could push BRETT to $0.25000, with $0.14266 as crucial support.
Brett (BRETT), built on the Base network, recently noted a massive rally in seven days. BRETT’s price has smashed past $0.1400 and was up by 60% in a week, displaying massive bullish momentum.
When writing, the BRETT price traded at $0.1712, noting an intraday price drop of 1.80%. It has a total supply of 9.91 billion and ranked 59th with a market cap of $1.70 Billion.
While the Brett price has been increasing, its trading volume has surged. This contrast suggested that buying pressure might be nearing its peak. It set the stage for a 52-week high breakout in the following sessions.
Bullish Breakout Looms: BRETT Set Sights on $0.2000
In a recent tweet on X, Crypto aTOm said that the BRETT price has recently experienced a massive breakout. He added that the BRETT crypto had entered the region and hit multiple target levels. This suggested more bullish actions.
Following this breakout, the token rose above its crucial resistance level of $0.14266. It has a clear bullish pattern, increasing by 165%. According to the chart, the token was trading above $0.1600. It acted as a resistance point but has now become support.
This means the altcoin has gained traction and hopes to strike the ATH zone shortly. If the token continues its current movement, the psychological level could be tested in the $0.19000–$0.20000 mark. This represents a key barrier for the ongoing rally.
The BRETT price has crossed the 61.8% zone Fib levels and entered the 5th cyclic wave. A daily close above the $0.1750 mark would unlock the path toward the ATH levels.
BRETT Price Prediction: What Do Technical Indicators Say?
BRETT price prediction conveyed a bullish sentiment among the market participants. Bulls have grabbed their grip and marked their presence. Amidst the sharp rise of over 165%, sellers remained on the back foot and recently covered their short positions.
The token hovers around the upper Bollinger Band at $0.1704, signaling overbought conditions. The Relative Strength Index (RSI) curve rested around 71 at press time.
This highlighted that the buying pressure has outpaced the selling pressure. The chart had a positive divergence, signifying the bulls’ dominance.
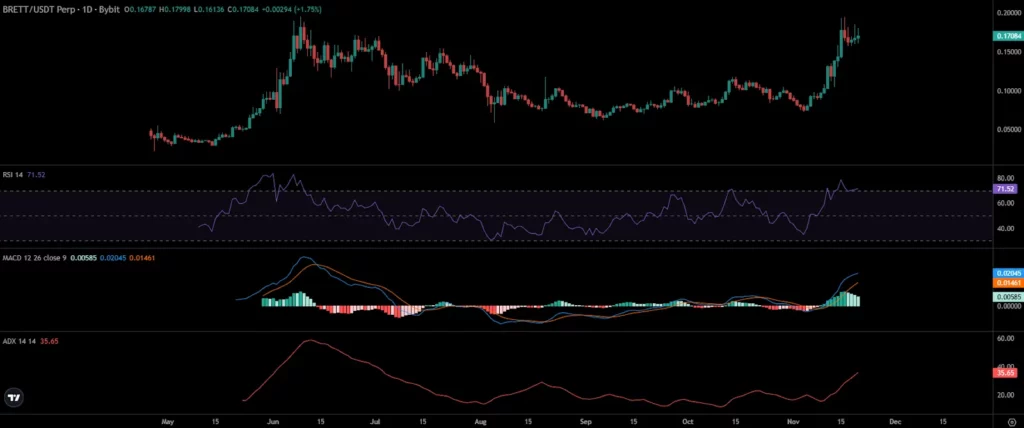
The MACD indicator saw a bullish crossover, revealing the bullish projections. Furthermore, the Average Directional Index (ADX) line was approaching the midline region. That represented the emerging bullish trend.
Futures Market Data Outlook
Data from Coinglass showed that the funding rate of BRETT crypto has been positive for the past two weeks. A positive funding rate hints at long contracts dominating the futures market. This could fuel the price up in the coming sessions.
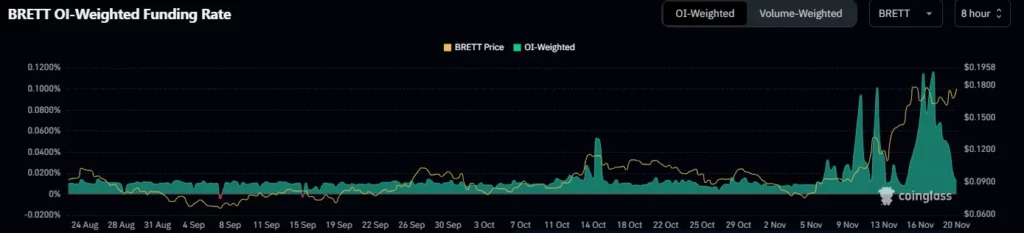
The Open Interest (OI) has risen over 2.10% to $84.16 Million over the past 24 hours. The immediate support zones for the BRETT price were $0.1600 and $0.1430. On the other hand, the resistance levels were $0.1800 and $0.1900.
Disclaimer
In this article, the views, and opinions stated by the author, or any people named are for informational purposes only, and they don’t establish the investment, financial, or any other advice. Trading or investing in cryptocurrency assets comes with a risk of financial loss.




