
 Bitcoin
 Ondo
Ondo NEAR Protocol
 Walrus
 Pearl
Pearl Pons
Pons Ethereum
- The Pendle price has triggered a breakdown from a channel and dropped to the 200-day EMA level.
- PENDLE crypto has been struggling between the 20-day and 200-day EMAs.
Since August, the Pendle (PENDLE) price has been in a bullish trend and has risen through an ascending channel. However, the price has slipped from the ascending channel and taking support on the 200-day EMA. The Pendle crypto price has been consolidating on the 200-day EMA for the past ten days, and a bounce back is expected.
On a wider time frame, the Pendle token price was continuously facing resistance from a major resistance level of $7. In the first week of December, the price displayed a reversal from this level. Whales have started accumulating PENDLE coins, which may have a positive impact on the PENDLE price.
Whale Activity Increased in the Pendle Crypto
As the price struggles to post gains, whales have amassed the Pendle crypto. A notable number of Pendle tokens were recently removed from exchanges by a whale. That indicates a probable bump or an escape from anticipated degradation.
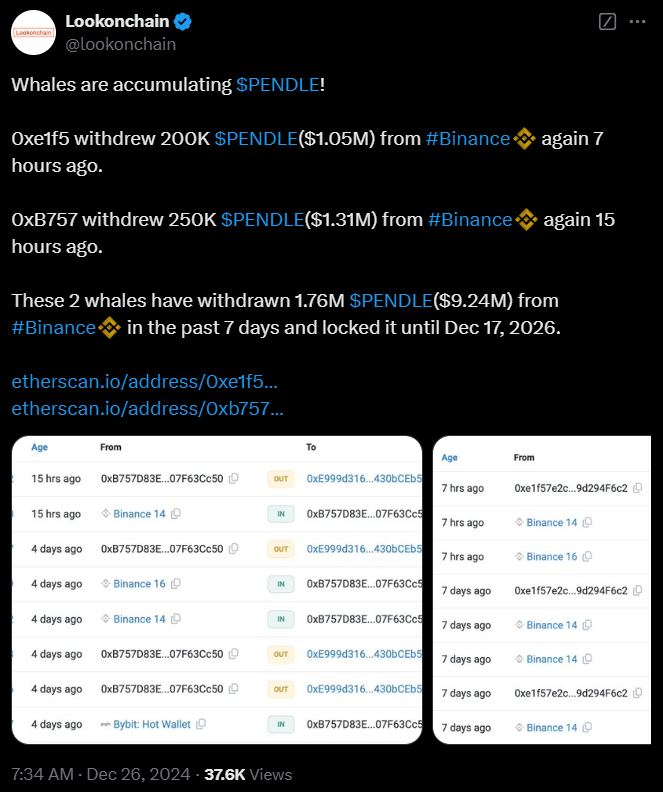
The withdrawal of 200,000 Pendle cryptocurrency was part of the Binance transaction. This action is consistent with a whale’s growing affection for Pendle, which appears to be attempting to stay afloat in the larger market.
Pendle Price Technical Analysis Over 1-D Timeframe
Pendle crypto was trading at $5.25 at press time, which has surged by 7.21% over the past 24 hours. This crypto’s market capitalization was $813.74 million, and the 24-hour trading volume was $50.83 million.
The price has triggered a breakdown from the channel and sellers were struggling to drag it down below the 200-day EMA. Once the Pendle token price slips below the 200-day EMA, sellers may dominate its trend. Losing this EMA could initiate profit booking, which may trigger a massive sell-off.
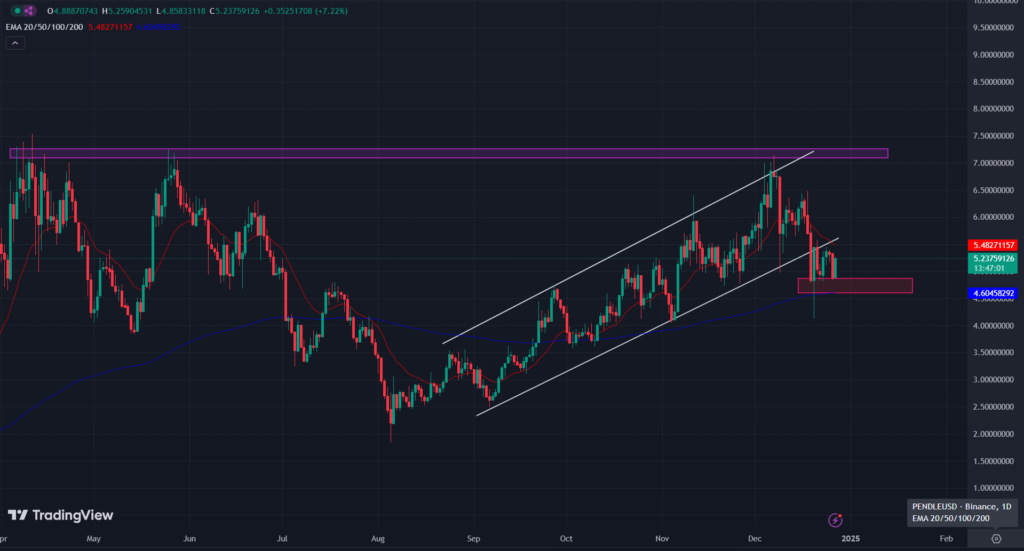
Amid this, whale activity has increased as large holders started staking. If the price defends the 200-day EMA, it could be a buying signal. Once the price exceeds the 20-day EMA, bullish momentum can be observed.
The bullish trend might disturb near the major resistance level of $7. If the PENDLE price triggers a breakout from the $7 mark, a decent bullish rally for the long term can be seen.
The Awesome Oscillator (AO) signaled a shift from bullish to bearish momentum when its green bars turned to red ones. The AO value of 0.023 is negligible because it is so near to zero. That points to a lackluster market momentum, which could indicate a shift in the market’s dynamics.
If the price breaks below the crucial support level at 5.000 USDT and the rising bearish AO volume (red AO) coincides with this move, further declines may occur.
Pendle Price Analysis and Forecast Based on Chart and Whale Activity
Pendle’s current price action reflects a critical juncture as it hovers around the 200-day EMA after breaking out of an ascending channel. While the price has faced resistance around the $7 mark and demonstrated a recent reversal, the accumulation by whales suggests a potential bullish sentiment that could influence future price movements.
If PENDLE maintains support at the 200-day EMA and breaks above the 20-day EMA, it may signal a buying opportunity and pave the way for a bullish rally. However, if it fails to hold above the 200-day EMA, the risk of a significant sell-off could increase. It could underscore the importance of monitoring both whale activity and broader market dynamics.
Disclaimer
This article is for informational purposes only and provides no financial, investment, or other advice. The author or any people mentioned in this article are not responsible for any financial loss that may occur from investing in or trading. Please do your research before making any financial decisions.




