
 Zerebro
 Bitcoin
 Quantus
 Pearl
Pearl Starknet
 ZKsync
 NEAR Protocol
- XRP price saw a 7% decline in a week. However, it was still stuck in a tight range.
- Market indicators represent bearishness and suggest further decline ahead.
Ripple (XRP) price remained in a tight range, and bears dominated the market last week. Since hitting a 52-week high mark of $2.90, bulls failed to attain follow-on buying momentum. Furthermore, a significant profit booking was observed from the higher trajectory.
Over the past week, the XRP price dropped more than 7% and slid below the 20-day EMA mark. However, it stayed above the $2 mark and showed strength on the charts.
At press time, the Ripple price traded at $2.11, noting an intraday decline of over 4.33%. Its market cap slipped to $122.89 Billion, ranked 4th among the top crypto coins.
Despite XRP’s bearish sentiment, the $2 support level has been a stronghold for bulls. Previously, the level was tested multiple times, and a rebound was exhibited.
Is the XRP price Poised for a Breakout: Analyst Weigh-In
A recent tweet by XRP Whale highlighted that the XRP price is ready for an upsurge. The token has formed a bullish flag pattern and could break the trendline barrier soon.
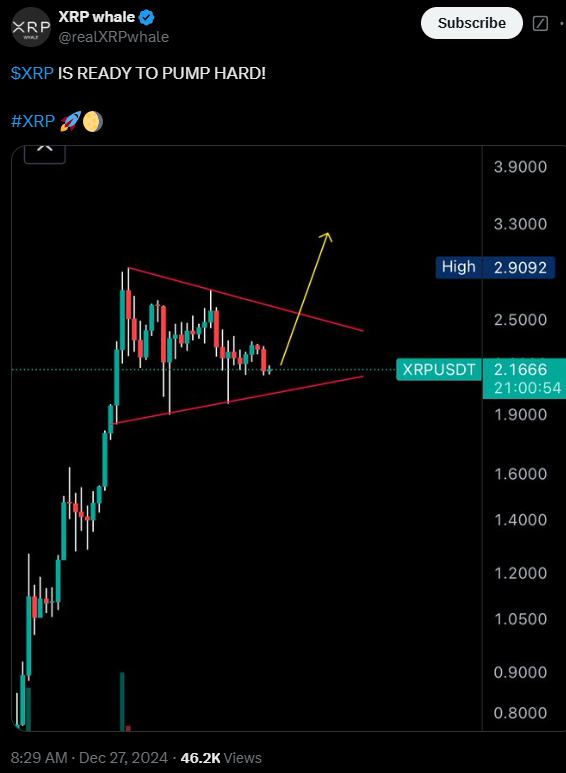
In case of a breakout, the Ripple price could reach $3. Moreover, the token can aim for the $3.30 mark in the following sessions.
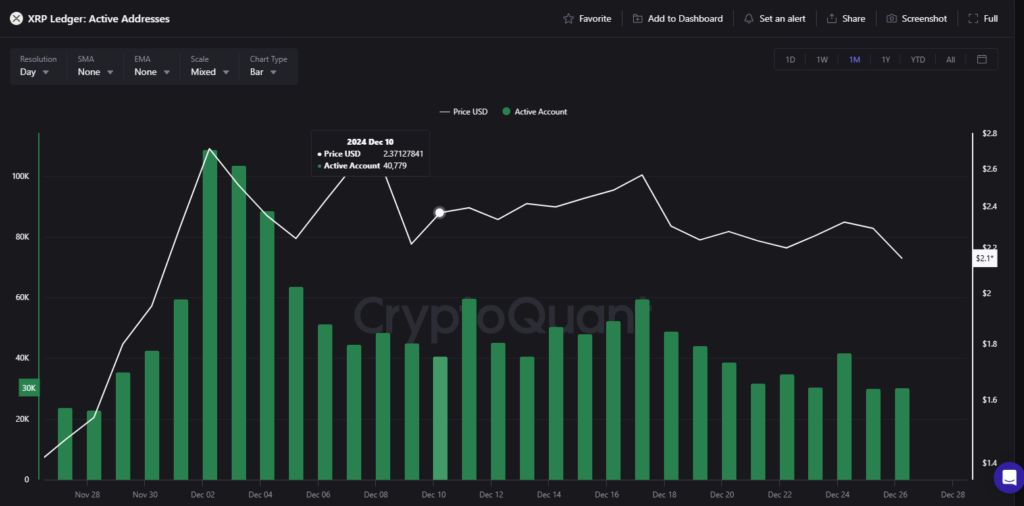
Also, the daily active addresses have noted a fresh spike and soared 0.28%. This signaled that participants were looking to enter the dip and gain confidence.
XRP Price Prediction: What Do Charts Say?
After bouncing off the resistance zone at $2.00, the XRP price has been trending downward. The token is typically expected to retest the $2 mark, the range lower’s support zone.
Moreover, technical indicators are hinting at a continued downward momentum for XRP. That was driven by heightened selling pressure. Notably, the Relative Strength Index (RSI) represented a bearish crossover and revisited the neutral line.
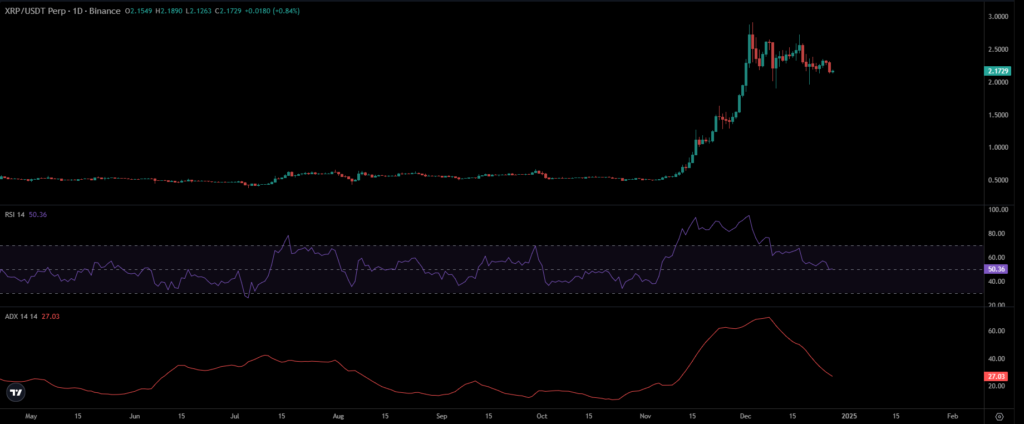
Also, the Average Directional Index (ADX) line has fallen below the 30 threshold. It showed that a downtrend was looming, and the altcoin could see a decline ahead.
The market is in a bearish phase, with the Aroon Downline currently being higher than the Aroon Up. It could unfold a fall or stabilize near the critical support zone at $2.
Shorts in the Majority
Data from Coinglass shows that XRP’s Long/Short Ratio on exchanges indicates sellers are positioning themselves to maximize the shorting opportunity.
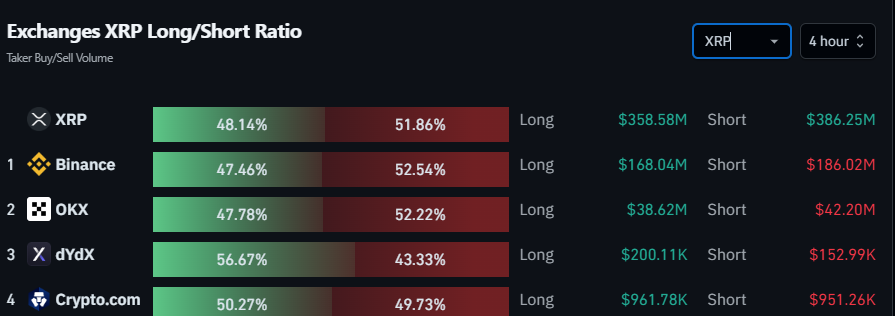
Shorts held a 52.54% share of the open contracts with a $22 Million difference between short and long positions. This reflected the bearish bias with the possibility that XRP may retest and breach the $2 mark shortly.
Moreover, the Open Interest (OI) shed over 28.94% to $2.01 Billion. That conveyed aggressive, long, unwinding activity over the past 24 hours.
It replicates a fear among the traders for the significant downside risk and has covered their positions. The immediate support zones for the XRP price were $2 and $1.80. At the same time, the resistance zones were $2.30 and $2.50.
Disclaimer
This article is for informational purposes only and provides no financial, investment, or other advice. The author or any people mentioned in this article are not responsible for any financial loss that may occur from investing in or trading. Please do your research before making any financial decisions.




