
 Zylo Ecosystem
 astronaut
 Pearl
Pearl Walrus
 Starknet
 Pudgy Penguins
 Bitcoin
- ICP formed a bullish pennant pattern token.
- ICP price has smashed the key moving averages.
- The declining trendline pushed the ICP crypto downward.
Internet Computer (ICP) has been in a bullish pennant pattern for a wider time frame. Yet, in the short term, sellers have dominated the market. The pennant pattern is often considered a signal for an impending breakout.
Since November, the ICP crypto price has been boosted and squeezed. However, a downward trendline has been acting as resistance, causing the ICP price to decrease since December.
ICP Crypto Has Shaped Bullish Pennant Pattern: What’s Next?
ICP crypto was trading at $10.60 at press time, which has declined by 6.16% over the past 24 hours. The market capitalization was $5.05 Billion, and the 24-hour trading volume was $167.49 million.
The ICP coin price has formed a bullish pennant pattern on a daily time frame. However, the price has been struggling in breakout territory. It was trading over the 200-day EMA.
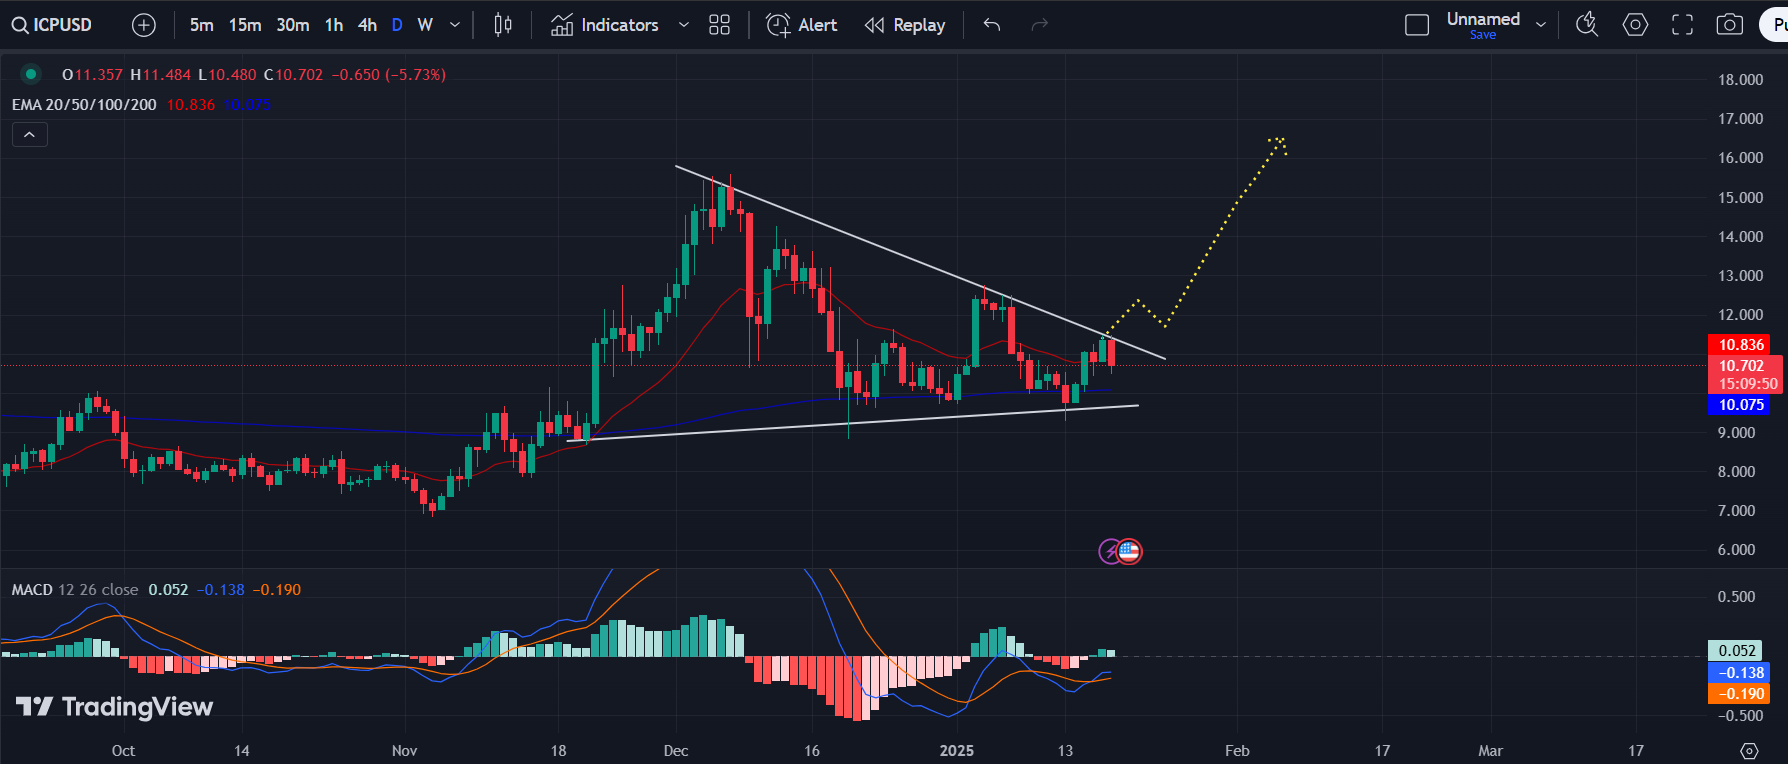
Suppose the ICP crypto triggers a breakout from the pennant pattern; it would be a bullish signal. Buying momentum can be anticipated once the price exceeds the $12 mark. Suppose the price is over the $12 mark and may continue the bullish trend.
Alternatively, sellers may dominate ahead if the ICP price slips below the 200-day EMA. Buyers might panic if the price is below the support level of $9.80. Here, most traders and investors might prefer to book profit, which may result in a strong bearish trend.
The RSI has triggered a golden crossover with the RSI-based moving average regarding the technical indicators. MACD has exceeded the Signal line but is staying in the negative territory.
ICP Price on the Verge of Breakout: What’s Next?
The ICP chart displayed a bullish pennant pattern, a breakout structure suggesting a possible price increase. After a significant increase, this pattern was created when the price fluctuates between two convergent trend lines.
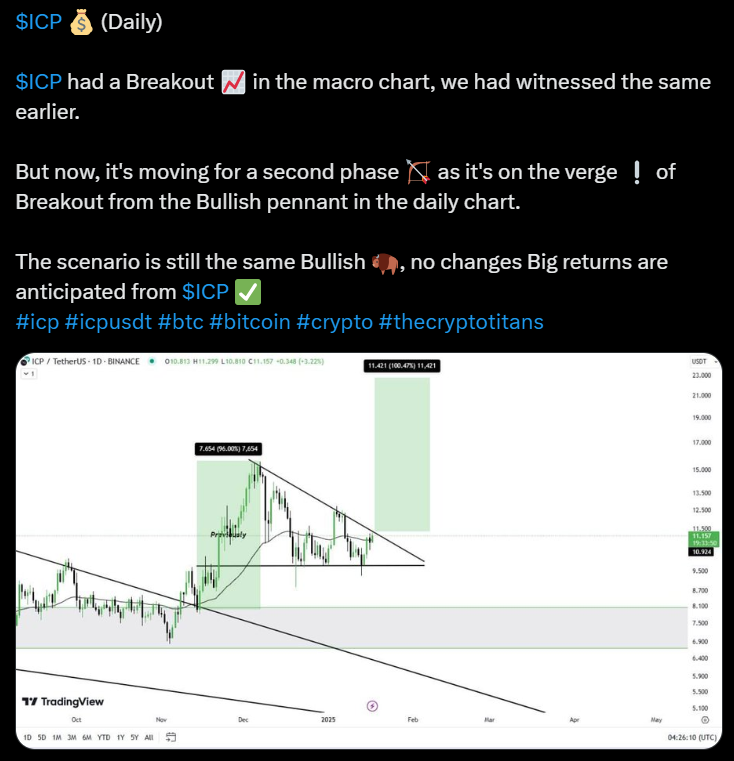
As @cryptotitans11 pointed out, this pattern resembles a previous macro chart breakout. This resulted in an ICP crypto price spike of 90% or more.
As the price gets closer to the upper trendline, the token’s price action stays inside the pennant. The bullish thesis for ICP is supported by the 200-day EMA, which also provides support.
The breakout has raised the prospect of a sizable gain in the days ahead. Furthermore, the traders are awaiting confirmation of it.
ICP Price Analysis in Breakout Zone
ICP crypto was currently positioned at a critical juncture, which was noted by forming a bullish pennant pattern. While the ICP price has shown resilience above key moving averages, it is currently under pressure from a descending trendline.
A breakout above the $12 mark could signal a renewed bullish momentum, attracting further buying interest. Conversely, a drop below the 200-day EMA or the support level of $9.80 could lead to a significant bearish shift. This could happen as selling pressure mounts.
Monitoring technical indicators such as RSI and MACD will be essential in assessing the potential for either scenario. As the market evolves, traders and investors should remain vigilant and adapt their strategies accordingly.
Disclaimer
In this article, the views, and opinions stated by the author, or any people named are for informational purposes only, and they don’t establish the investment, financial, or any other advice. Trading or investing in cryptocurrency assets comes with a risk of financial loss.




