
 NEAR Protocol
 Pyth Network
 Uniswap
 Pearl
Pearl Quantus
 Aerodrome Finance
 Starknet

- Ethereum has faced strong resistance around the $4K level, testing it multiple times in the past year.
- Whales have accumulated over 100,000 ETH during recent price dips, signaling bullish sentiment.
- The MACD indicator shows a bullish trend, with the MACD line above the signal line, suggesting potential upward momentum.
Ethereum price has hardly breached the level of $4,000 in the last year, as there is robust resistance at this level. The cryptocurrency has tried many times to go up to a level above $4K.
However, the ETH crypto has failed to sustain the new prices at this level. Technical indicators and whale activity pointed to favorable market signals. These signals may allow Ethereum to establish another rise, which could break through $4K.
Resistance at $4,000: A Persistent Barrier for Ethereum
As noted by renowned crypto analyst Ali Martinez, the Ethereum price has struggled against the $4K barrier for several months. It serves as a key resistance level because the ETH price failed to break through it more than once.
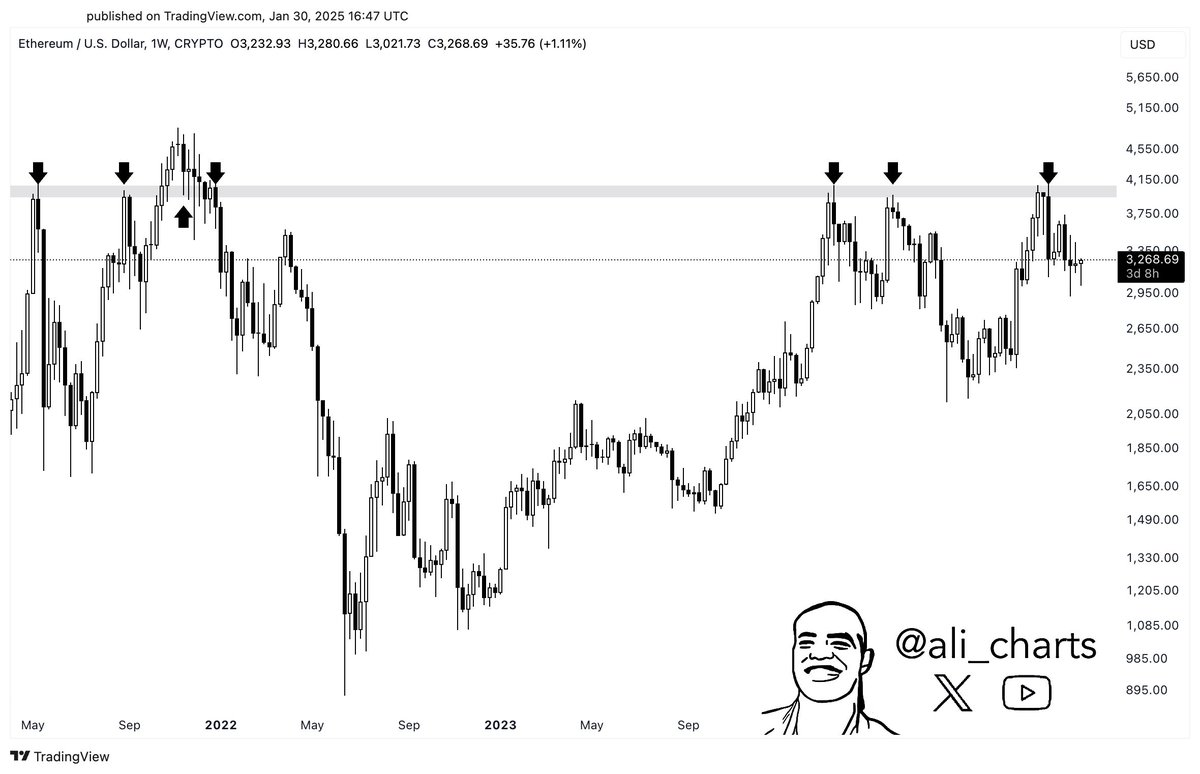
Each time it gets near the $4K price mark, selling pressure hits the asset, pushing it downwards. These recurrent activities could be ascribed to retail and institutional investors’ preferences.
The inclinations could behave in response to certain psychological hurdles surrounding the $4,000 price of Bitcoin. Market participants say this repetitive $4K price assessment demonstrated optimism that the Ethereum price will break through this resistance point.
Financial market history has shown that repeated asset probing of a resistance level might increase the likelihood of a price breakthrough.
Whale Activity: Accumulating Ethereum During Price Dips
More so, during the recent Ethereum price dip, whales made substantial cryptocurrency purchases. According to on-chain data, these entities have purchased more than 100,000 ETH in a short period.
The substantial accumulation demonstrated that big investors believe Ethereum will experience enduring growth. At the same time, they could take advantage of reduced prices in current dips.
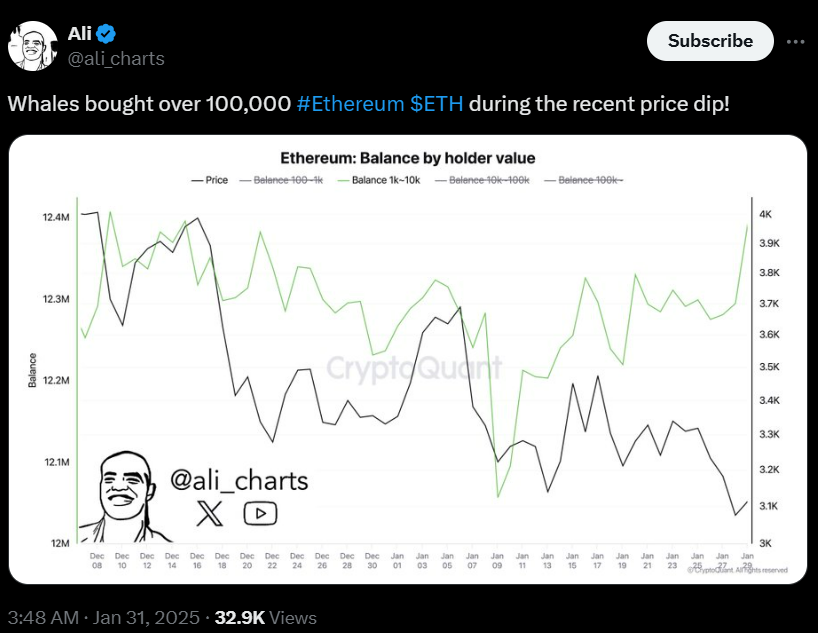
In this sense, whales always become an essential market sentiment figure since their buying capability heavily influences the value of assets. These investors actively purchase Ethereum at low prices because they believe it indicates positive future potential for the cryptocurrency.
MACD Indicator: Bullish Momentum Signals Potential Breakout
Furthermore, the Moving Average Convergence Divergence indicator (MACD) showed bullish trends for the Ethereum price throughout the past few weeks. The MACD line was above the signal line, indicating that the upward movement rate was increasing.
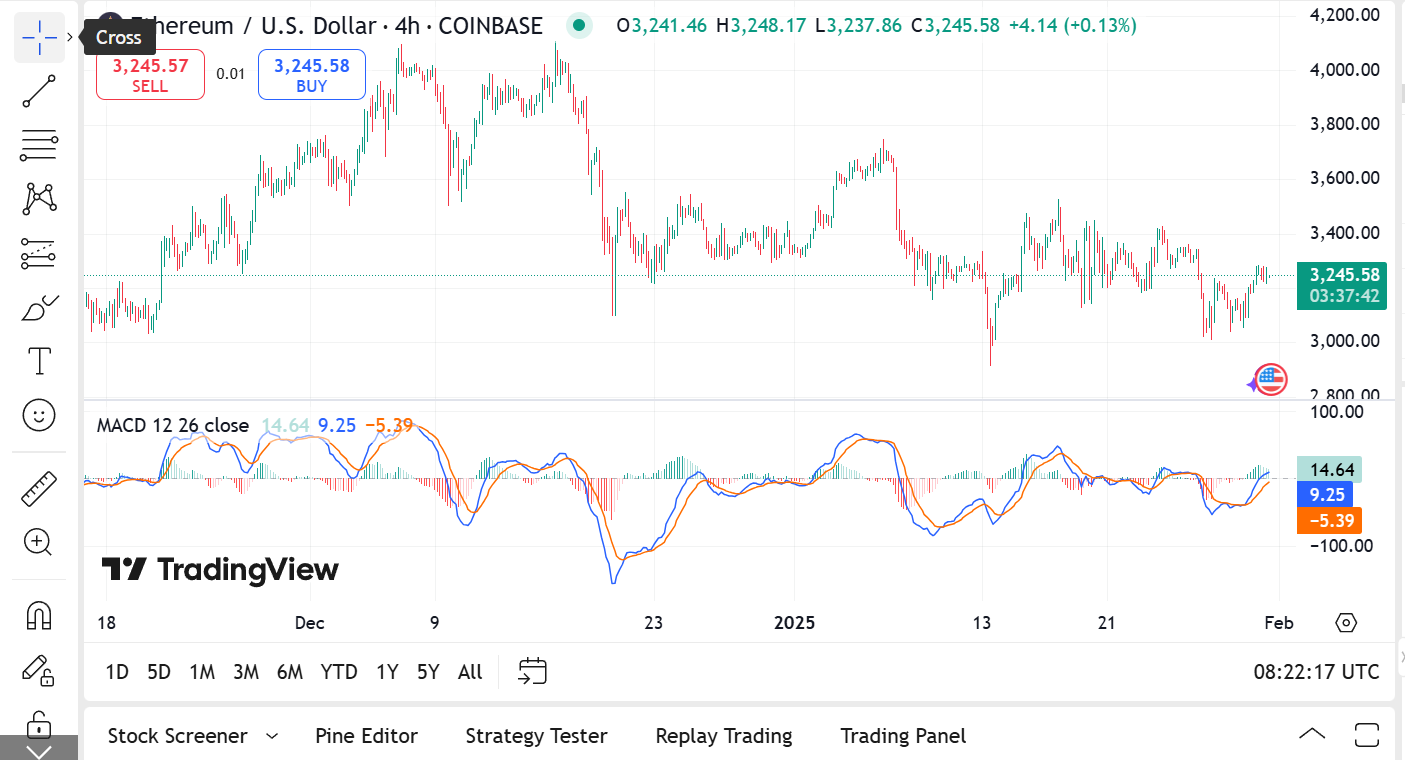
The positive difference between the two lines is a classic sign of a potential trend reversal or continuation in a bullish direction. The positive MACD histogram indicates strong buying pressure, which sustains market bullishness.
Technical analysts commonly examine the MACD as an early signal to predict price movements. That’s because this tool shows leading signs of changing market sentiment. A market uptrend exists when the MACD line stays above the signal line, indicating potential price appreciation.
At press time, the Ethereum price traded at $3,292.80, up 2.33% in 24 hours. The intraday high reached $3,289, with a low of $3,216. The trading volume dropped 20.38% to $19.54B.
Key support for the ETH price was $3,200, with resistance at $3,350. A breakout above resistance may signal further gains.
Disclaimer
This article is for informational purposes only and provides no financial, investment, or other advice. The author or any people mentioned in this article are not responsible for any financial loss that may occur from investing in or trading. Please do your research before making any financial decisions.



