
 no crying in the casino
 Pyth Network
 NEAR Protocol
 Starknet
 Quantus
 Pearl
Pearl Bitcoin
- LINK made an ascending channel pattern over the monthly chart where bulls are expecting a bounce back from the rising support line
- The pairs of LINK/BTC and LINK/ETH at 0.00082269 BTC and 0.02886403 ETH slips over -5.87% & -2.80% respectively
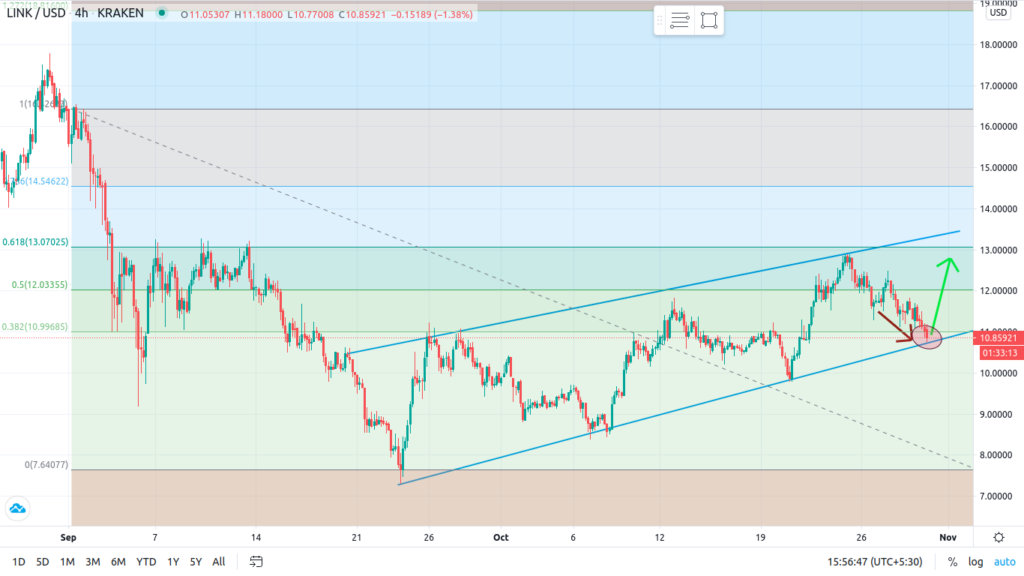
Analyzing the monthly chart of Chainlink, a bullish movement is traced followed in the ascending channel pattern making higher highs and higher lows respecting the pattern formed. The coin is trading near the support line and investors expecting the bounce from there as after testing the low of $8.47 on the downside, the coin continuously makes the bullish movement and now trading at $10.83 with the price drop of -5.45% in the last 24-hours and recorded volume of $1,798,436,695 with a market capitalization stands at $4,218,369,973.
Level $10.80 acts as the support drive over the pattern formed followed by $9.80. However, on the other hand, the resistance lies at $12.05 and $13.07 in the coming trading sessions.
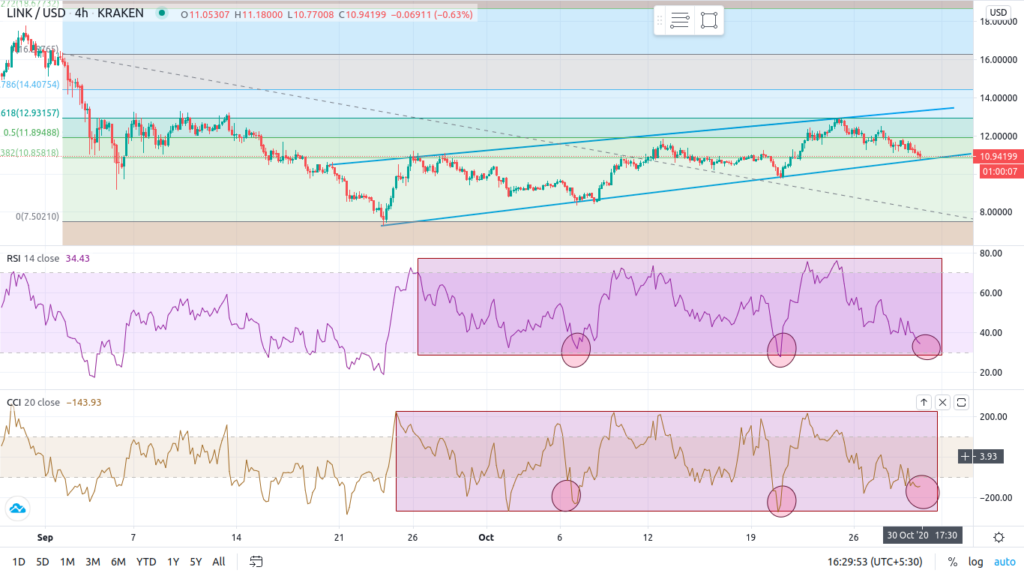
The Relative Strength Index (RSI) is at level 34.00. On studying the indicator, it takes support on the tip of the oversold region and bounces back again to the overbought region making similar kind of pattern at every occasion. While in the bullish region it makes a double top pattern and then slips.
The Commodity Channel Index (CCI) forms a similar pattern like RSI. Testing lower level and again bounces sharply to the bullish zone and slipping from the higher region again to oversold zone supports the bullish movement. This concludes that Chainlink has been highly volatile for this month.
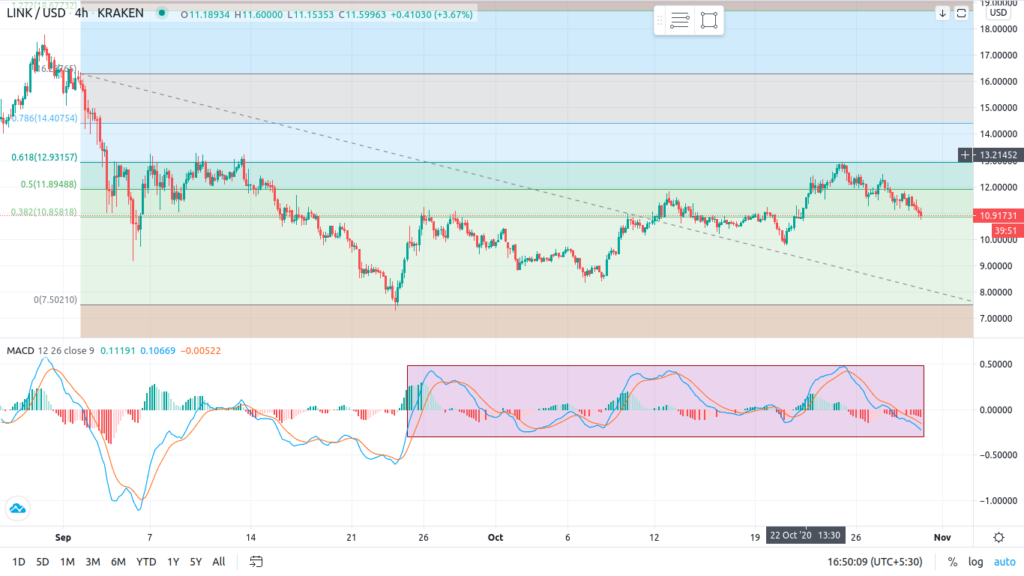
The Moving Average Convergence & Divergence (MACD) on looking at the chart, a negative crossover is observed and currently trading with more significance of long-term average line (RED) over the short-term line (BLUE), trading parallel on a downturn with no sign of recovery.
Support levels: $10.80 & $9.80
Resistance levels: $12.05 and $13.07



