Dacity Coin
 Pearl
Pearl Bitcoin
 Injective
 Pudgy Penguins
 Quantus
 Starknet
- Stellar Lumens performed a negative momentum on Tuesday’s trading session
- XLM coin price is $0.3278, which is down by 4.05% in the last 24-hour time-frame and 25.04% up from the previous week
- XLM/BTC pair is negative with a loss of 1.76% in Tuesday’s trading session (0.00000947)
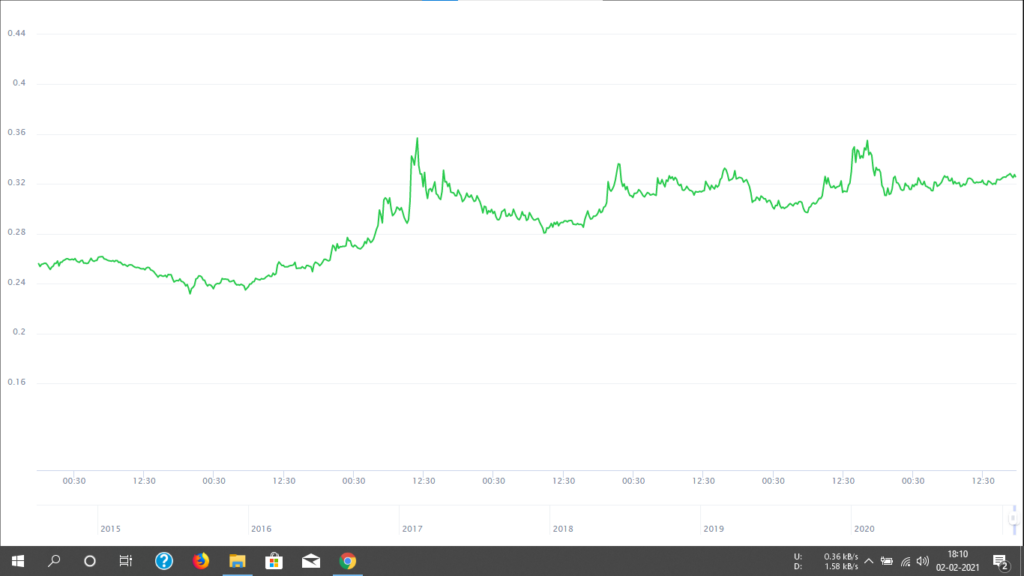
XLM had positive momentum on the weekly chart, and it went up to $0.4023 on January 7, 2021, while breaking above the resistance zones created in the past. XLM coin price set a mark of a 52-week high. Meanwhile, the trading volume $2,687,369,446.18 in the last 24-hour time-frame represents a decrease in the value by 14.48%. The XLM/ETH pair is in an uptrend with a value of (0.00022940) which is down by 1.68% in Tuesday’s trading session.
XLM Technical Chart Indicates A Positive Momentum
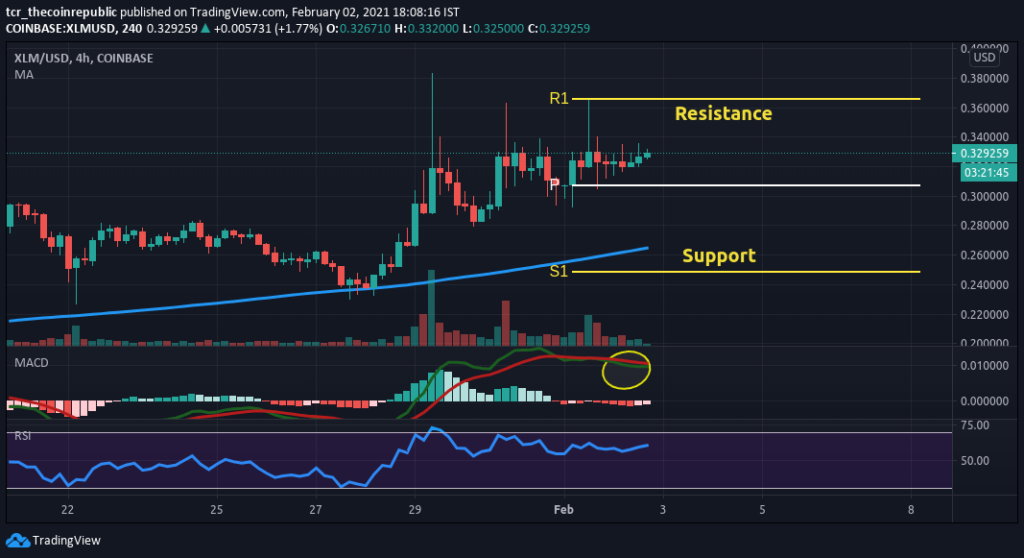
The technical chart of Stellar Lumens price highlights a negative trend. XLM coin price is at $0.3278. According to pivot points, the key support level for XLM is placed at $0.2491. If it moves up, the key resistance level to watch is $0.3656. While Diving into the weekly chart of 1-hour time frame forms a three black crows candlestick pattern, indicating the bears have overwhelmed the bulls and are now in control.
Volume indicator with the value (32.832M) reflects a moderate buying volume in coin. One can further expect a decrease in buying volume if selling starts in the coin.
SMA-200, price is at $0.2637, which acts as another strong support in the coin. The price above the SMA and investors can expect a bearish trend in the coin.
MACD indicator (Bearish), No bullish crossover signal line was spotted on February 02, 2021, during the trading session it indicated a sell signal in the coin. Also, it denotes red bars on Histogram.
Meanwhile, the RSI indicator (Bullish) with a value of 61.98 indicates a buy signal in the coin for a short while. One can observe a decrease in value in upcoming trading sessions.
Conclusion
XLM coin price is down by 4.05% on Tuesday’s trading session. The price is above the SMA-200. Investors can see the price move towards the support level of $0.2491 if it breaks below SMA-200. All technical indicators suggest a sell signal in the coin.
Resistance: $0.3278
Support: $0.2491