
 no crying in the casino
 NEAR Protocol
 Starknet
 Pyth Network
 Pearl
Pearl Quantus
 Pudgy Penguins
- Stellar Lumens performed with favorable momentum on Saturday’s trading session
- XLM current price is $0.5450, which is up by 18.80% in the past 24-hour time-frame and 61.70% up from the previous week
- XLM/BTC pair is positive with a gain of 2.95% in Saturday’s trading session (0.00001154)
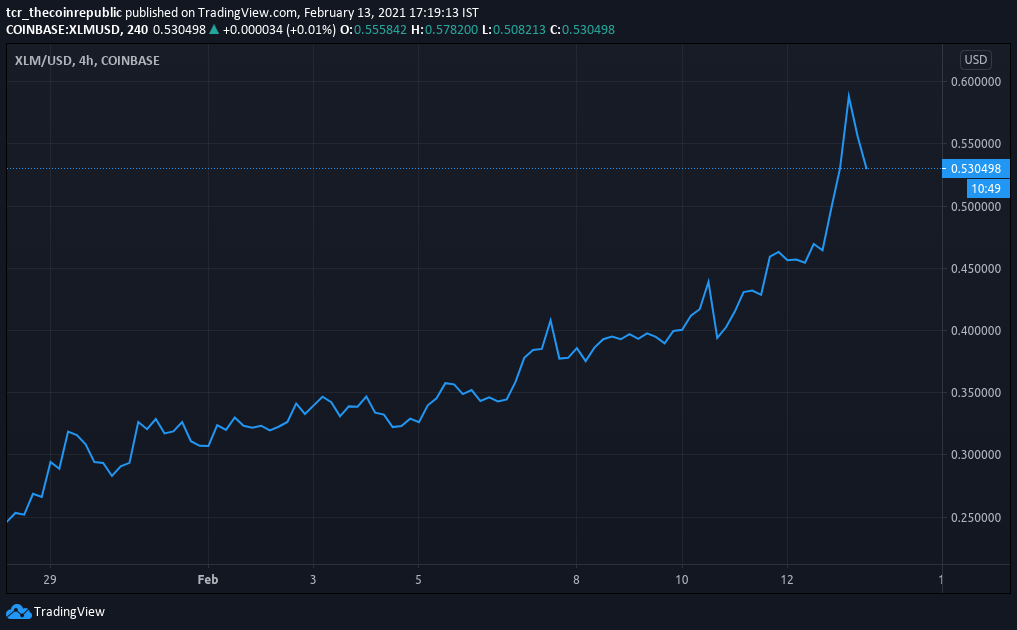
Stellar Lumens had positive momentum on the weekly chart, and it progressed around $0.6008 on February 13, 2021, while breaking over the resistance zones made in the past, wherein, XLM price set a record of an all-time high a few hours ago. Meanwhile, the trading volume of $5,314,760,477 in the last 24-hour time-frame represents an increase in the value of 69.41%. The XLM/ETH pair is favorable with a value of (0.00029795) that is up by 3.54% in Saturday’s trading session.
XLM Technical Chart Indicates a Positive Momentum
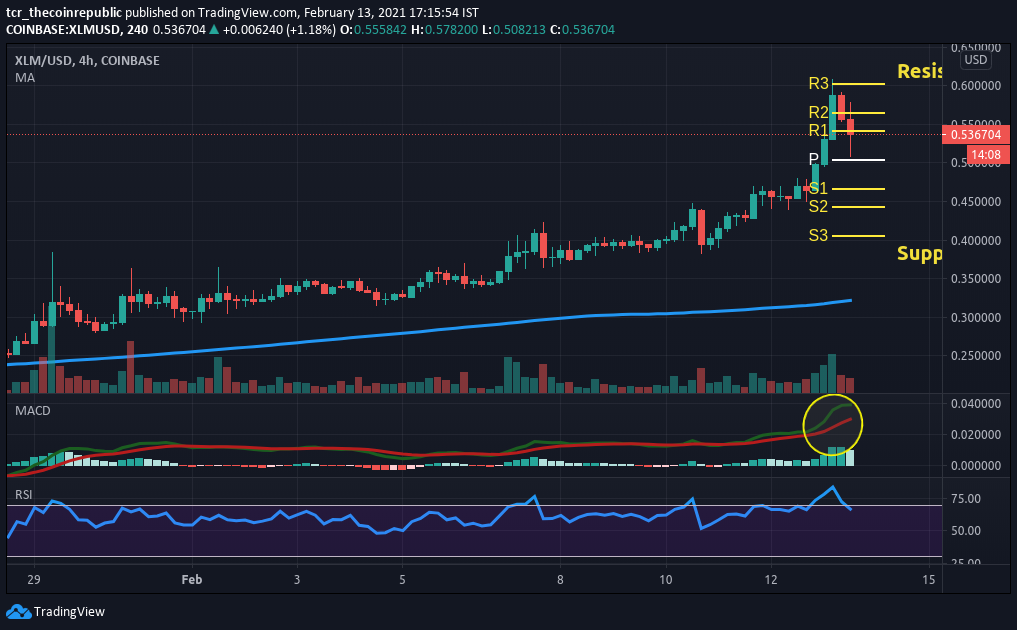
The technical graph of Stellar Lumens highlights a favorable trend. By comparison, XLM current price is at $0.5450. In accordance with pivot points, the critical support level for XLM is placed at $0.4670. Whereas if it goes up, the important resistance levels to observe are $0.5409, $0.5654 and $0.6018. While diving into the weekly graph of 4-hour time-frame, it completes a bearish engulfing candlestick pattern, suggesting the bears have overwhelmed the bulls and are now in control.
Volume index with the sum (94.408M) reveals a selling volume . Investors may further anticipate a decrease in selling quantity in future trading sessions.
SMA-200, price is currently at $0.3217, which acts as another dependable support from the coin. The cost is over the SMA, and investors can expect a bullish trend in the coin.
MACD index (Bullish), bullish crossover over signal line seen on February 13, 2021, suggested a buy signal in the coin throughout the trading session. It denotes the massive green bars on Histogram.
Meanwhile, the RSI index (Bullish) using a value of 68.26 indicates a buy signal in the coin. One can observe a growth in value in upcoming trading sessions.
Conclusion
XLM current price is up by 18.80% on Saturday’s trading session. The price is above the SMA of $0.3217, and investors may expect the movement of price towards the resistance level of $$0.5409, $0.5654 and $0.6018. All technical indicators urge a buy signal in the coin.
Resistance: $0.5409, $0.5654 and $0.6018
Support: $0.4670



