
 Zerebro
 Bitcoin
 Quantus
 Pearl
Pearl Starknet
 ZKsync
 NEAR Protocol
- Cardano coin chart over the medium-term time frame is trading under the descending triangle pattern with average volume activity.
- The crypto asset is trading below its vital moving averages of 20, 50, 100, and 200-day lines.
- The pair of ADA/BTC is trading at 0.00002653 BTC with a -2.13% change in the last 24-hour, and the ratio of ADA/ETH is CMP at 0.0003201 ETH with an intraday drop -1.10%.
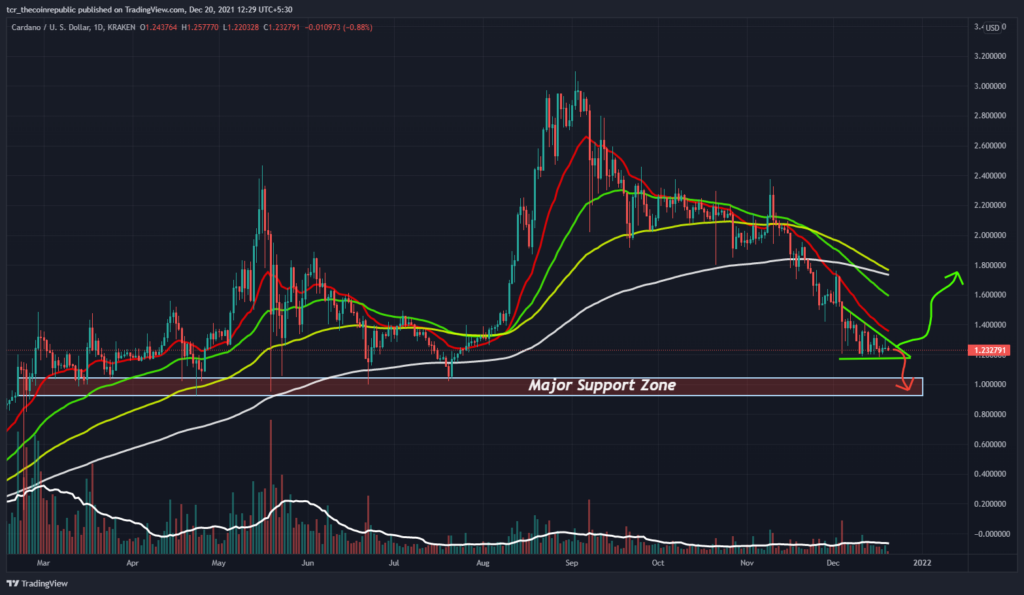
Cardano coin chart at the monthly chart is trading under the descending triangle pattern. Meanwhile, the crypto asset is currently trading above its primary support zone and placed under the triangle pattern. The coin is sustained below its all vital moving averages of 20, 50, 100, and 200-day, while volume is average. We can expect a significant recovery from the lower levels in upcoming trading sessions if the coin holds the significant support zone. Once the token sustains above its DMA of 20 and 50-day line with supportive volume action will boost more upside in upcoming sessions.
Volume over the monthly chart is continuously lower and recorded near the average volume line, which needs to improve enormously for a positive breakout. Support on the lower side is $1.16 and $1.05, whereas resistance on the higher side is $1.59 and $1.78.
Cardano coin chart at the monthly chart is trading under the descending triangle pattern, with average volume line
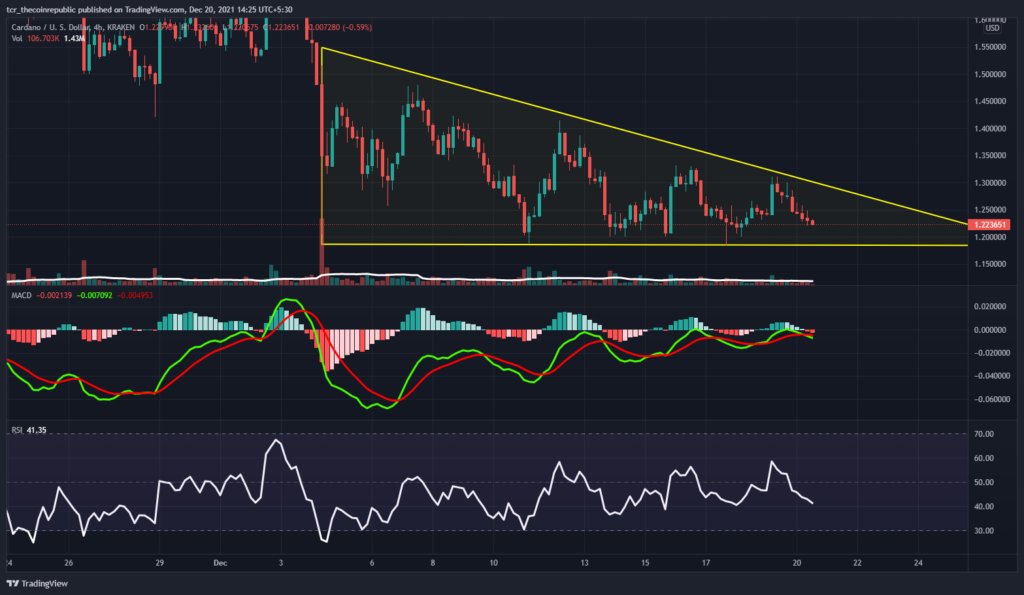
Cardano coin chart at the monthly chart is trading under the descending triangle pattern, with average volume line. Volume activity at the 4-hour time frame is lower and needs a substantial increment in upcoming trading sessions. The technical parameters are sideways and higher, with a slight recovery from lower levels. On the monthly chart, Cardano is trading at $1.22 with an intraday dip of -4.93%, and the volume to market cap ratio is at 0.02766.
Relative Strength Index (BULLISH): Cardano coin chart RSI is heading higher after testing the oversold zone from the lower side. The coin is currently trading under the descending triangle pattern and CMP near the lower zone of the pattern and RSI at 40.
Moving Average Convergence Divergence (MIXED): The daily chart indicates a mixed or neutral trend at the 4-hour time frame. The buyer’s signal line (green) and the seller’s (red) overlap.
Support levels: $1.16 and $1.05
Resistance levels: $1.59 and $1.78.
DISCLAIMER
The views and opinions stated by the author, or any people named in this article, are for informational ideas only, and they do not establish the financial, investment, or other advice. Investing in or trading crypto assets comes with a risk of financial loss.




