
 streamoors
 Injective
 Pudgy Penguins
 Celestia
 Pearl
Pearl Sui
Sui Bitcoin
- Cardano price has been consolidating inside the horizontal range-bound area after leaving the descending parallel channel over the daily chart.
- ADA crypto is trading below the 20, 50, 100, and 200-day Daily Moving Average.
- The pair of ADA/BTC is at 0.00002341 BTC with an intraday gain of 0.77%.
Over the daily price chart, the price of Cardano has been declining through a parallel downward channel. In order to signal its breakdown, the token is trading toward the lower trendline after stabilizing inside the horizontal range-bound area. The ADA coin has to bounce back above the consolidation phase’s top trendline and then later, above the parallel channel. To enter its recovery phase, ADA currency has to garner support from customers. The lower trendline of the parallel channel must not be breached by the token as it approaches the consolidation period. To prevent more falls, ADA has to draw in more customers. ADA crypto has been consolidating inside the price range of $0.42 and $0.60.
Cardano’s price is currently CMP $0.45 and has increased by 2.43% in the previous 24 hours in terms of market capitalization. The intraday trading session has seen a 40.94% spike in trade volume. This demonstrates that buyers are seeking to build up their own stock in order to allow ADA to hold at the lower trendline. The volume to market cap ratio is 0.0519.
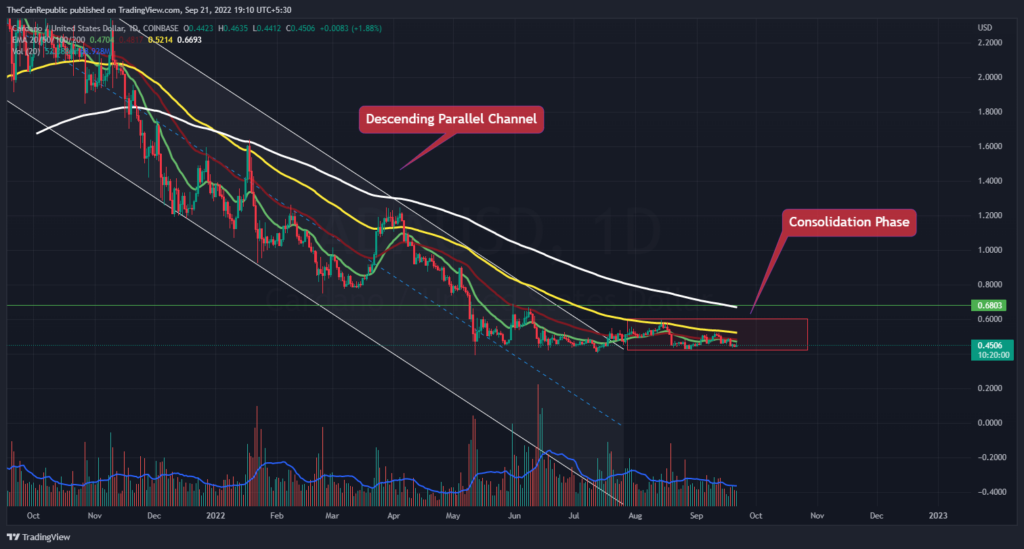
For the price of the ADA coin to enter its recovery phase, more buyers are required. The digital currency’s value has dropped below the 20, 50, 100, and 200-day Daily Moving Averages. The ADA coin has to bounce back above the consolidation phase’s top trendline after escaping the parallel channel. The volume that is gradually declining indicates that the ADA coin is in a downturn.
What do Technical Indicators suggest about ADA?
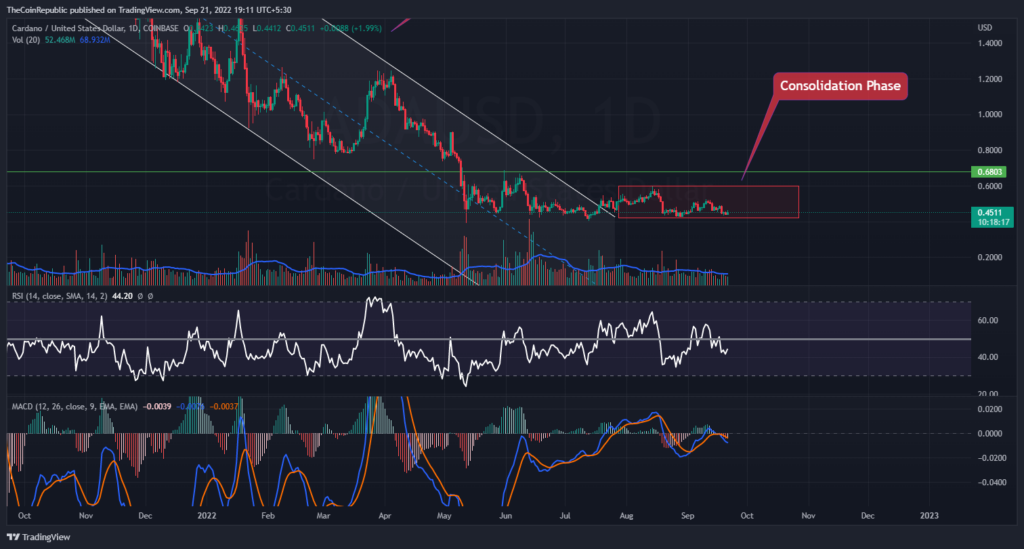
The recovery phase is being prepared for by ADA coin piercing. The token is, however, under pressure from short sellers at the moment and is moving in the direction of the lower trendline. To avoid falling further, ADA must rally support. Technical indicators point to the ADA coin’s rising momentum.
The relative strength index clearly shows the ADA coin’s positive momentum. At 44, the RSI is moving in the direction of neutrality. The ADA coin’s consolidation phase can be seen on the MACD. For a positive crossover, the MACD line is moving in the direction of the signal line. Investors in ADA must watch the daily price chart for any directional changes.
Conclusion
Over the daily price chart, the price of Cardano has been declining through a parallel downward channel. In order to signal its breakdown, the token is trading toward the lower trendline after stabilizing inside the horizontal range-bound area. The ADA coin has to bounce back above the consolidation phase’s top trendline and then later, above the parallel channel. To enter its recovery phase, ADA currency has to garner support from customers. The lower trendline of the parallel channel must not be breached by the token as it approaches the consolidation period. The ADA coin has to bounce back above the consolidation phase’s top trendline after escaping the parallel channel. The volume that is gradually declining indicates that the ADA coin is in a downturn. To avoid falling further, ADA must rally support. Technical indicators point to the ADA coin’s rising momentum. The ADA coin’s consolidation phase can be seen on the MACD. For a positive crossover, the MACD line is moving in the direction of the signal line. Investors in ADA must watch the daily price chart for any directional changes.
Technical Levels
Support Level: $0.40
Resistance Level: $0.60
Disclaimer
The views and opinions stated by the author, or any people named in this article, are for informational ideas only, and they do not establish any financial, investment, or other advice. Investing in or trading crypto assets comes with a risk of financial loss.




