
 Zerebro
 Bitcoin
 Quantus
 Pearl
Pearl Starknet
 ZKsync
 NEAR Protocol
- NFT/USDT is down 0.63% today
- NFT/USDT has taken a bounce of almost 37% from its all-time low which was created recently
APENFT has become a victim of the bears as the digital asset has taken a deep dive from its all-time high of $0.000006871. This caused the market to witness depths never seen before as the market keep on creating new lows. Such a movement has taken a big toll on the value of the asset which has declined by 95%.
NFT/USDT is trading at $0.000000315 which is 37% recovery from its recently created all-time low at $0.000000227. The investors are under constant selling pressure as the bears keep the prices low. A major shift of trend was observed when the bulls lost the daily support level of $0.00000300 back at the start of 2022.
The Daily chart shows the formation of a descending channel
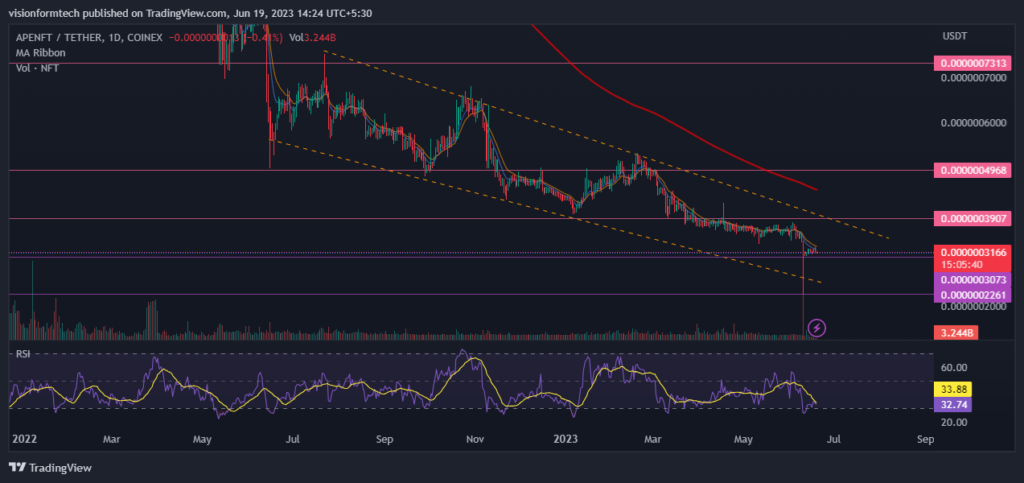
The daily chart shows the present market conditions. The market structure represents a strong downtrend followed by the formation of new lows. On closer observation, the price seems to have taken a bounce of almost 35%. This Pump came right after the market created a new all-time low. It’s a sign of the presence of buyers who were interested in buying at this price.
Such investors are just trying their luck as the price is trading at its lows and there is a potential for huge upside. This potential can be justified by the formation of a downward channel structure. This is a bullish reversal pattern and the buyers are hoping to break the resistance. Such a move will spark the buying interest which can pump the price to almost 80% at the level of $0.000000731.
The 4H chart shows a sideways market condition
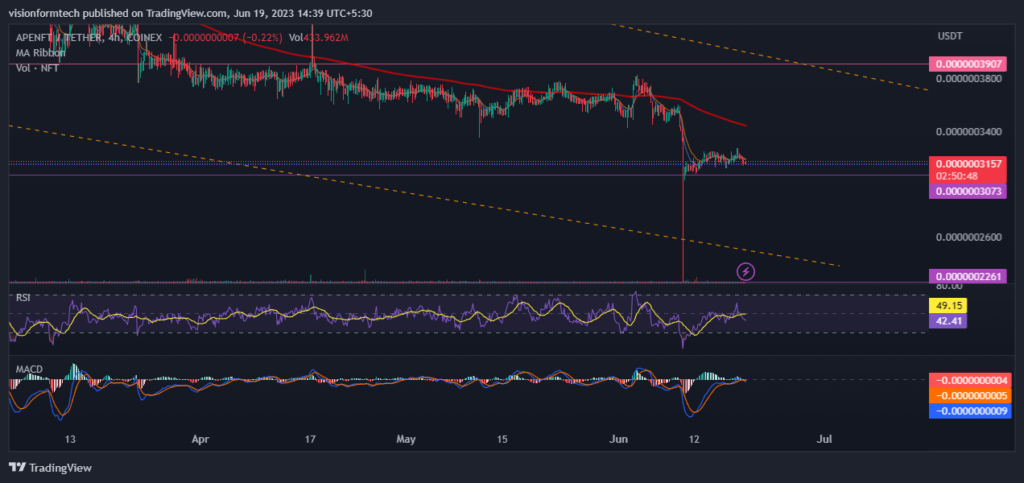
The 4H chart is representing sideways market conditions. The price is moving in a small range just after it saw high volatility in the last week. Such market conditions represent a lack of market participants and the buyers show less interest due to the falling prices.
The current market price is holding a risk of almost 25% due to a big rejection candle. A new support is created at an all-time low and it’s difficult to predict where the price might go in between. On the upside, if the bulls have multiple hurdles. The Price must cross the 200 EMA, the daily resistance of $0.000000390, and the trendline of the downward channel. It is going to be very difficult to move up and will require a massive volume with a bullish candlestick formation on the Daily timeframe.
RSI: The RSI indicator is currently at 44.60 and the RSI has crossed the MA line towards the downside. This is a sign of bearish to sideways market condition.
MACD: The MACD indicator is showing a lack of momentum, the signal line and the MACD are moving close to each other representing a sideways condition and a big move can be seen in the short time.
200 EMA: As observed, on the 4hr, the price is trading below the 200 EMA(exponential moving average) which acts as a significant resistance. This is a clear indication of a downtrend where the sellers are in control and for a trend reversal, the price must break and trade above the 200 EMA.
Technical levels:
Support Levels: $0.000000303- Support 1
$0.000000226 – Support 2
Current Price: $0.000000315
Resistance Levels: $0.000000390 – Resistance 1
$0.000000496 – Resistance 2
Conclusion :
APENFT is on a selling spree where the market interest is more inclined towards selling. Buyers are struggling to defend support levels and have failed to breach resistance. This is creating doubts in the mind of investors and would keep them away from investing further. The only hope is to flip the price above the trendline of the falling channel which will unlock the potential of at least 80% upside. Current market conditions make it very risky and Investors must follow proper Risk-management to keep the losses in control.
Disclaimer
The views and opinions stated by the author, or any people named in this article, are for informational purposes only and do not establish financial, investment, or other advice. Investing in or trading crypto assets comes with a risk of financial loss.




