
 Zylo Ecosystem
 Walrus
 Bitcoin
 Sui
Sui Quantus
 Quant
Quant Starknet
- Litecoin (LTC) price has fallen down by more than 4% in the past 24 hours.
- Litecoin derivatives data states that there has been an increment of $3.23 Million in long positions against $529.6K positions on the short side.
Litecoin (LTC) is a cryptocurrency designed by a former Google engineer. It was designed to provide fast, secure low-cost payments by leveraging the properties of blockchain technology. It was created based on the Bitcoin protocol.
Litecoin (LTC) price is currently trading at $96.46 and has declined by 4.65% in the past 24 hours. It holds a market cap of $7,064,775,179 and ranks 11th in the crypto market. It received a volume of $977,001,474 in 24 hours. The volume-to-market cap ratio of Litecoin is 13.92% which indicates medium volatility in the market.
Litecoin price prediction reveals that it was moving in a symmetrical triangle pattern since December 2022. It was forming lower highs and higher lows. After June 2023, It started attracting buyers’ interest which can also be observed in the rising volume. Buyers started dominating and the LTC price made a strong breakout of the trendline which was acting as a resistance.
Technical Analysis of Litecoin Cryptocurrency
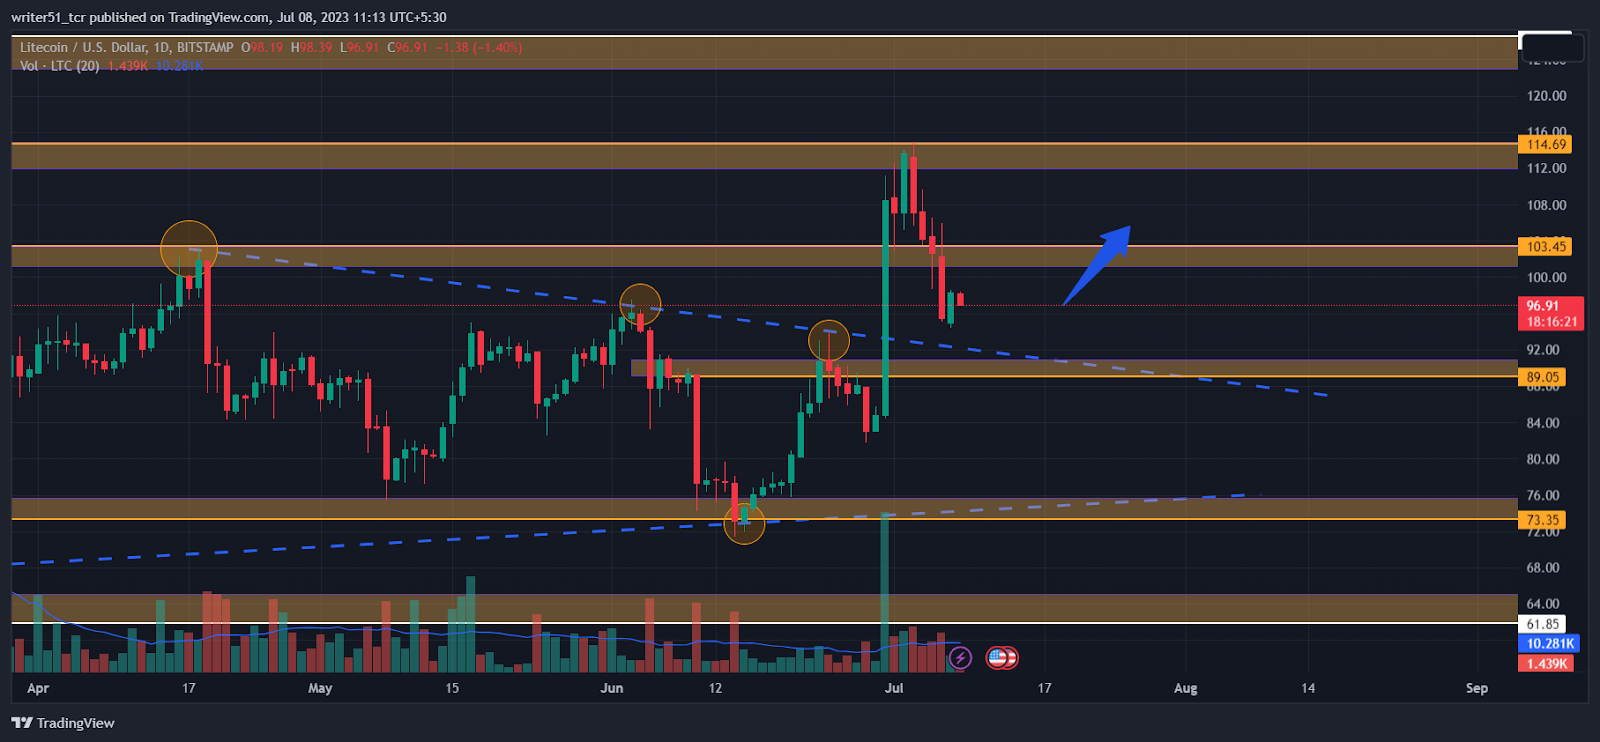
Currently, the price is in a short-term pullback phase after a strong rally of more than 20% to the upside. The LTC price has got support from a 20-day EMA and trying to sustain above it. Also, the Litecoin price has reached where it had previously given a breakout. Hence, it should work as a support for the market. Now if the price is able to sustain above 20 EMA then again buyers may show interest in it and the price may rise further higher.
Litecoin (LTC) Price Indicator Analysis
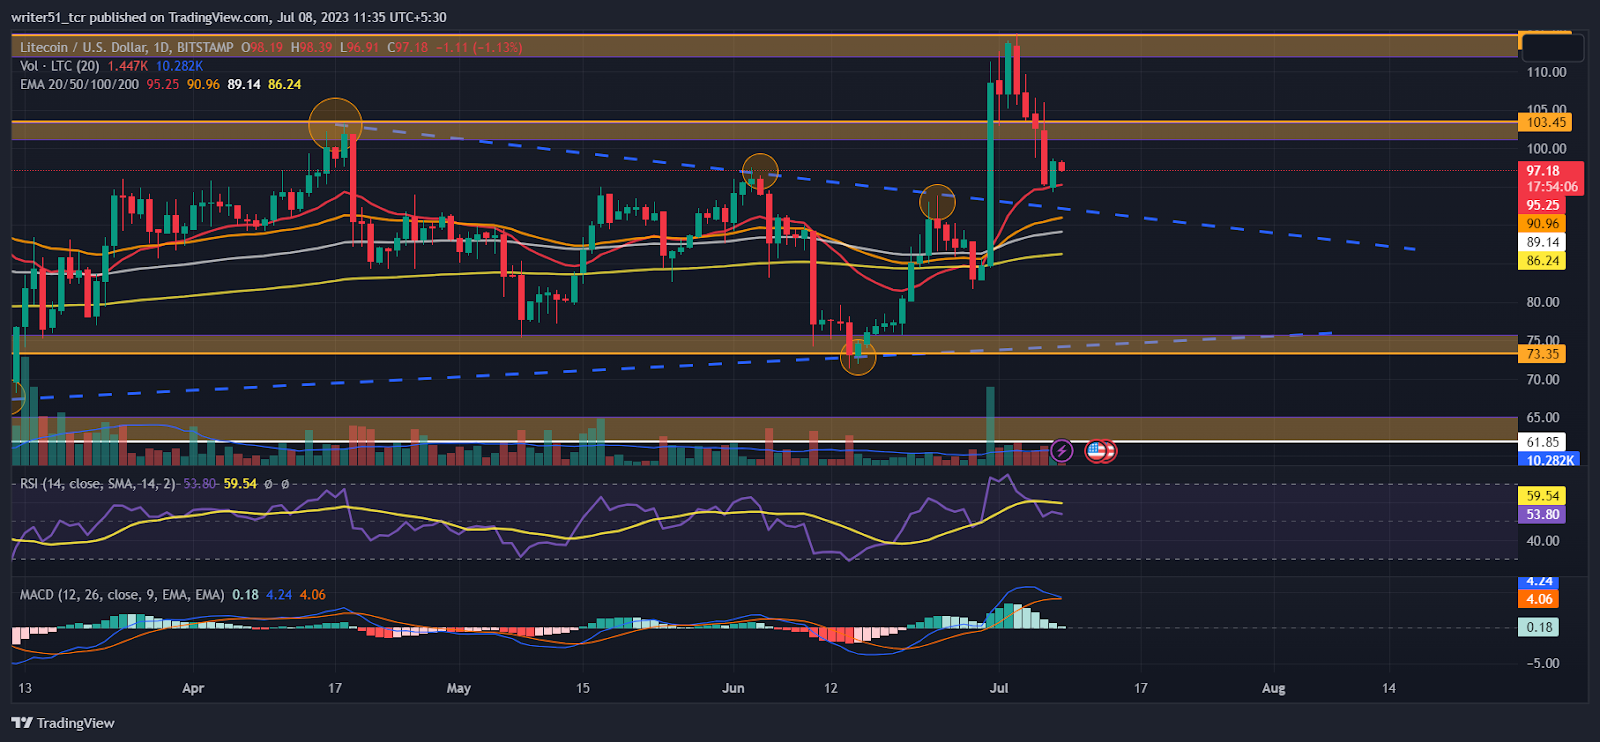
Litecoin price is currently trading above all the EMA which shows bullishness in the cryptocurrency. The price is taking support from 20 EMA and trying to sustain above it. Also, a golden crossover(50 EMA and 200 EMA) indicates bullish momentum to continue until the price is trading above it.
At the time of publishing, the RSI value is 53.71 and that of the SMA line is 53.51. RSI has crossed sma line to the downside but it is taking support from the mean line which indicates neutral to bullish sentiment in the short term
MACD lines are about to cross each other but are trading above the mean line which indicates neutral to bearish sentiment in the market
Conclusion
As per the Litecoin price prediction, It is observed that Litecoin (LTC) price has already made a bullish move, and a pullback after that shows there has been some profit booking after the bullish move. However, LTC price has taken support from 20 EMA which is a positive sign. Now, it needs more fresh buyers to sustain above the current levels and reach new highs.
Technical Levels
- Support levels are at $84.6 and $73.3
- Resistance levels are at $103.4 and 114.2
Disclaimer
The views and opinions stated by the author, or any people named in this article, are for informational purposes only, and they do not establish financial, investment, or other advice. Investing in or trading crypto or stock comes with a risk of financial loss.




