
 Injective
 Celestia
 streamoors
 Sui
Sui Pudgy Penguins
 Bitcoin
 Pearl
Pearl
- Ontology (ONT) advanced by +5.35% since last week.
- Ontology (ONT) showed a spike of +30.00% in volume in the last 24 hours.
- The long/short liquidation for Ontology is at 0.96 which represents positivity in the market.
Ontology (ONT) is trading with long liquidation of $93.62K with an Open Interest of 6.66M resulting in a decline of -4.93% in Open Interest of Ontology contracts.
Ontology is a cryptocurrency defined as a high-performance multi-chain project also known as a distributed collaboration platform.
ONT was in a strong downtrend and has been declining for a very long time but recently it failed to break the most recent swing low and also started showing signs of change in the character of the price which somehow represents the presence of buyers in the market. There has been a rise of +18.72% in trading volume in the last 24 hours resulting in $14,294,033.
Ontology Technical Analysis
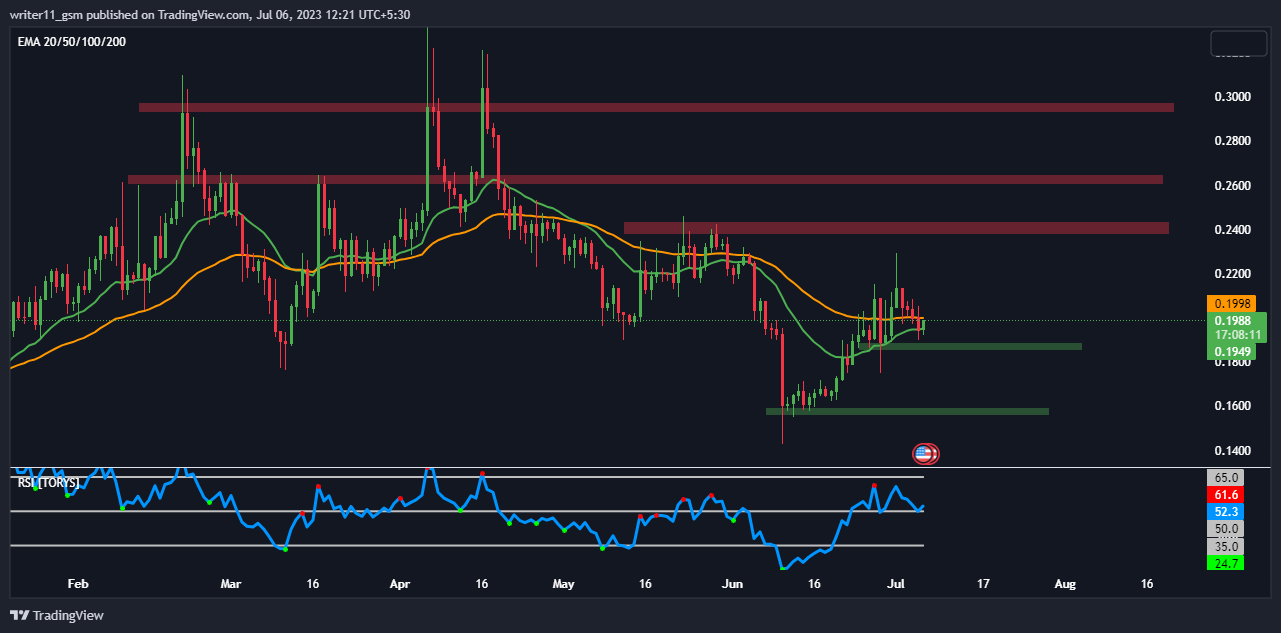
EMA
The market is trading above the 20-day moving average and is preparing to cross the 50-day moving average which represents the presence of buyers in the market.
Further, the space between the moving average is contracting which also indicates a change in trend is about to take place.
RSI
The RSI is currently trading above the level of 50 and is also trying to support at the same level which represents the sustainability in trend resulting in which we can see further higher levels in Ontology.
Market Structure
Ontology was consecutively declining from the higher levels but has recently stopped to fall further as it was unable to break the previous swing low and started to rise upwards creating a higher swing that is about to be broken out which can result in a good up move in the market.
Liquidity Analysis
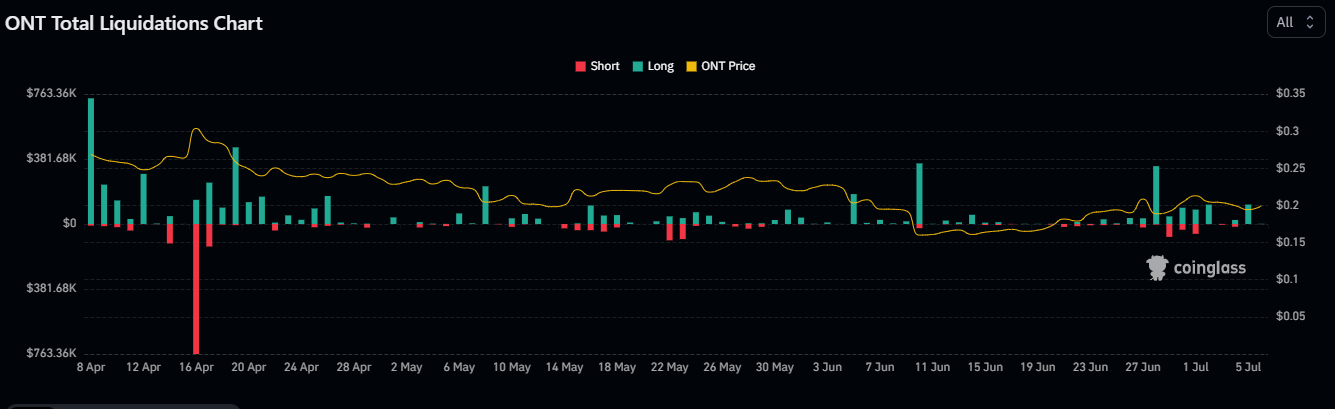
Based on the current liquidation chart there is a large number of long liquidations as compared to short liquidations based upon which there has been long liquidation of $114.5K against short liquidation of $43.32 in the last 24 hours as per coin glass.
Conclusion
Based upon the current chart of Ontology (ONT), there is a change in the structure of the market as the market did not break the last swing low and is currently trading above the 20-day Exponential Moving Average. If the market continues to move upwards in the momentum, it can result in a bullish crossover which will lead to a further preceding uptrend, also the RSI is trading above the level of 50 and the market is sustaining above the following RSI level which is a bullish sign for the market.
Technical Levels
- Support Levels – 0.1867, 0.1577
- Resistance Levels – 0.2401, 0.2623, 0.2940
Disclaimer
The information provided in this article, including the views and opinions expressed by the author or any individuals mentioned, is intended for informational purposes only. It is important to note that the article does not provide financial or investment advice. Investing or trading in cryptocurrency assets carries inherent risks and can result in financial loss.




