
 Dacity Coin
 Pearl
Pearl Bitcoin
 Sui
Sui Quantus
 Injective
 Zcash
Zcash
- Tesco Stock Price (LON: TSCO) stuck into the range between GBX 243.00 to GBX 257.00.
- TSCO Stock Price drops below 50 and 200 day EMA showcase trend is reversing down.
- Tesco PLC down by 13% from the recent swing high at GBX 285.00.
Tesco Stock Price (LON: TSCO) corrected 13% approx from its recent swing high and formed a bearish pattern. TSCO Stock Price slipping down by forming lower lows swings indicates bear dominance.
It dropped below the 50 day and 200 day EMA showcase the trend reversing in the downward direction. If the prices decline further then the EMAs might display a death crossover which will create concern for its investors.
In the mid of June, Tesco Stock Price dropped below the crucial support of GBX 256.00 which disturbed the sentiment of investors. However, the price did not collapse much and got stuck inside the range.
Presently, the prices are consolidating in the range between GBX 243.00 to GBX 257.00 and showing signs of base formation. The buyers are active near the demand zone and trying their best to rebound. The sudden spikes in the selling volume is visible indicates speculative activities are high.
Tesco Stock performed well in the beginning of 2023 and generated decent returns for its long term investors.
Tesco Stock Price closed the previous session at GBX 250.4 with an intraday rise of 0.60%. The market capitalization stands at 17.95 Billion GBP.
Will Tesco Stock Price bounce back?
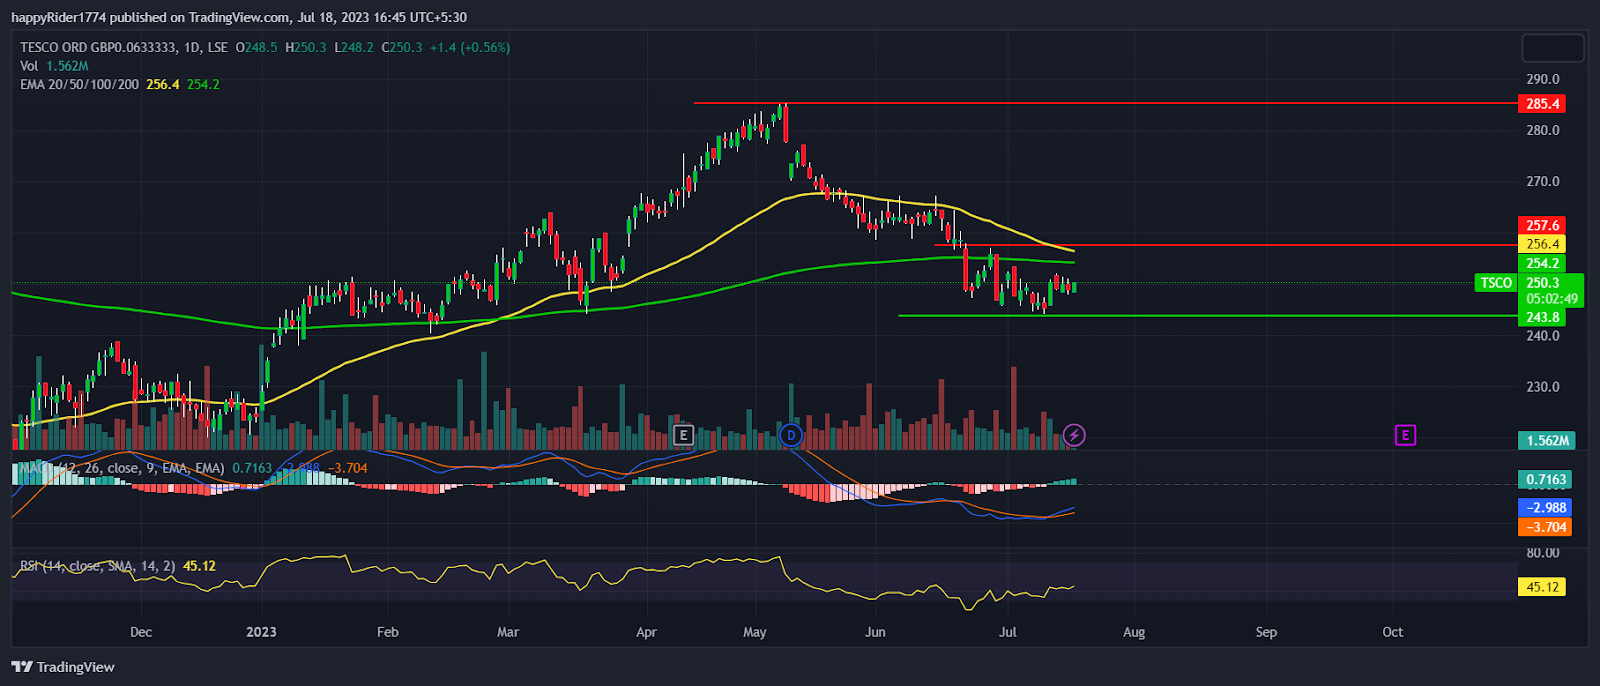
Tesco Stock Price faced rejection from GBX 285.00. Slow and steady prices declined and eroded the completed gains generated in 2023. Meanwhile, buyers tried to recover but due to the presence of strong sellers prices faced rejection.
Short term pull back is not sustaining indicates bears dominance. However, Till Tesco Stock holds the GBX 240.00 level the prices are expected to turn upward. But the prices will pick up the momentum only after the breakout of GBX 257.00 hurdle.
On the other hand, if the price drops below GBX 240.00 then the next phase of decline might trigger. The technical analysis suggests, Tesco Stock is in the correction phase but the probability of bounce is high till it holds GBX 240.00 level.
TSCO Stock formed inverted V-shape pattern
TSCO Stock Price formed an inverted V-shape pattern in the weekly time frame. It displayed a bullish candle in the previous week but price lacked momentum.
The MACD curve is below the zero line but it displayed a positive crossover. It indicates mild bullishness but the confirmation is awaited. The RSI at 43 denotes weakness and prices might reach the oversold territory.
Conclusion
Tesco Stock Price (LON: TSCO) corrected 13% approx from highs but still no signs of recovery is visible. TSCO Stock is in the correction phase but it might take a halt near GBX 240.00.
Technical levels
Resistance levels: GBX 257.00 and GBX 267.00
Support levels: GBX 243.00 and GBX 240.00
Disclaimer
The views and opinions stated by the author, or any people named in this article, are for informational purposes only. They do not establish financial, investment, or other advice. Investing in or trading crypto assets comes with a risk of financial loss.




