
 Dacity Coin
 Pearl
Pearl Bitcoin
 Injective
 Pudgy Penguins
 Quantus
 Starknet
- The price of Walmart Inc. stock rose above the exponential moving averages of 50, and 100 days.
- The price of Walmart Inc. shares is currently $159.74.
- The current market value of Walmart Inc. (NYSE: WMT) is $430.18 Billion.
Global retail giant Walmart Inc. is renowned for its extensive chain of supermarkets, outlet shopping centers, and outlet-style department stores. In 1962, Sam Walton founded Walmart which has since expanded to become one of the greatest retailers on the planet.
The Walmart Inc (NYSE: WMT) stock has a dividend yield of 1.43% and its payout ratio is 54%. The WMT stock pays dividends quarterly. This is a positive factor and buyers might take an interest in buying.
The Walmart Inc (WMT) stock is currently trading in an upward direction and the price is forming a higher high pattern.
According to the most recent chart, Walmart’s stock price is displaying a significant upward momentum that is driving it toward a new record high. The price of Walmart shares reached a spectacular high of $160.77 in April 2022 before dropping 27% the following month.
A strong reversal started and higher highs were formed during the course of the following year as the price found support at the $117.47 level.
The Walmart stock price has recently given a breakout from a very important resistance level of $258. The price has made an all-time high and the price is likely to rise in the upcoming days. The stock price has shown an increase of 5% in the last 2 weeks.
The overall pattern and the structure of the WMT stock are gaining strong momentum. Also, the profit of the stock is increasing.
Walmart Inc. (WMT) Stock Price Analysis
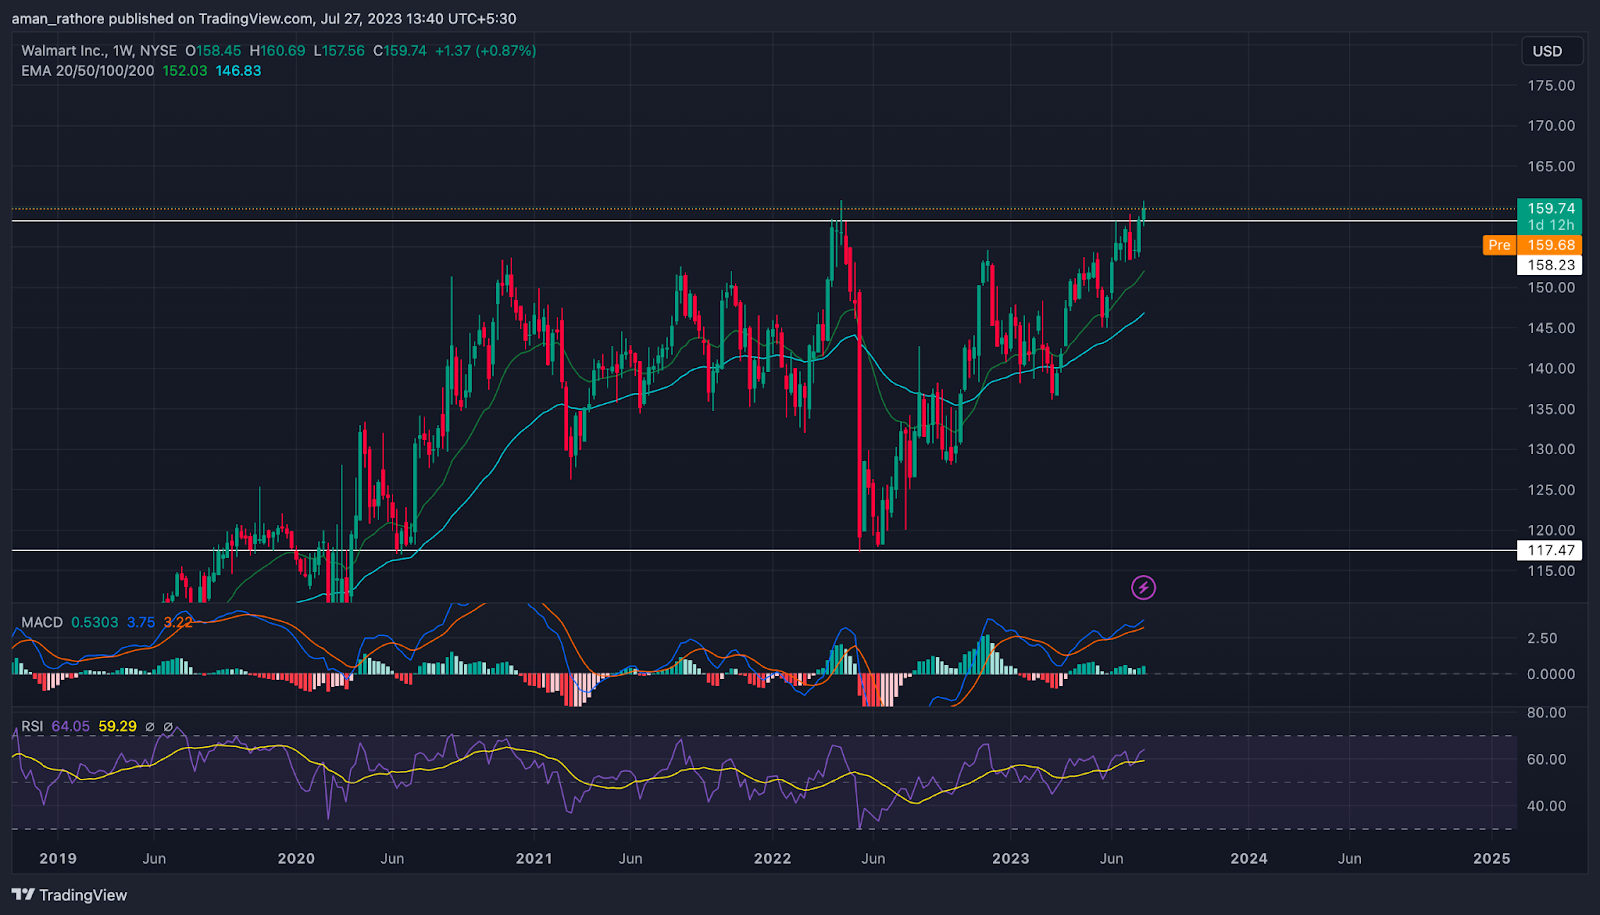
Source: WMT/USD.1W.NYSE by TradingView
Walmart Inc.’s price is trading above 50, and 100-day Exponential Moving Averages (EMA) which is a good sign and suggests that prices may rise.
A green histogram is created by the placement of the MACD and signal lines above the baseline. It implies that the market is moving upward.
The fact that the RSI is close to 59 levels and has not yet entered the oversold zone trend shows that Walmart stock is gaining some momentum and the price is likely to rise in the upcoming days.
Conclusion
In conclusion, the price of Walmart Inc. stock is showing positive trends and growth in price is rising by forming higher highs. The favorable EMA placement, the bullish MACD configuration, and the absence of overbought circumstances in the RSI all point to a bright future for Walmart Inc. shares.
Technical Levels:
- Support – $158.
- Resistance – $170.
Disclaimer
The views and opinions of the author, or anyone named in this article, are for informational purposes only. They do not offer financial, investment, or other advice. Investing or trading crypto assets involves the risk of financial loss.




