
 Zerebro
 Bitcoin
 Aerodrome Finance
 ZKsync
 Pearl
Pearl Pudgy Penguins
 Bitway
- QCOM stock price is down by 0.86% in the last trading session and is currently trading at $114.61.
- Qualcomm’s share price (NYSE: QCOM) experienced a post-result effect and slid down by 13% in the past 1 week.
QCOM stock price was in a strong uptrend after bottoming out in May 2023. The stock price was in a continuous uptrend and surged higher gaining nearly 20% till July 2023. The price surged higher forming higher highs and higher lows.
However, the short-term gain initiated the investors to sell and the stock declined nearly 12% in the past week after the disclosure of the quarterly results. Currently, the price is nearing its previous swing low and waiting for the buyer’s back to hold near the current level.
Qualcomm, Inc. (NYSE: QCOM) is a company that makes wireless products and services based on CDMA technology. CDMA is a way of sending voice and data over wireless networks. Qualcomm also makes GPS products. Qualcomm has two main segments: QCT, which makes CDMA chips and software, and QTL, which licenses CDMA technology.
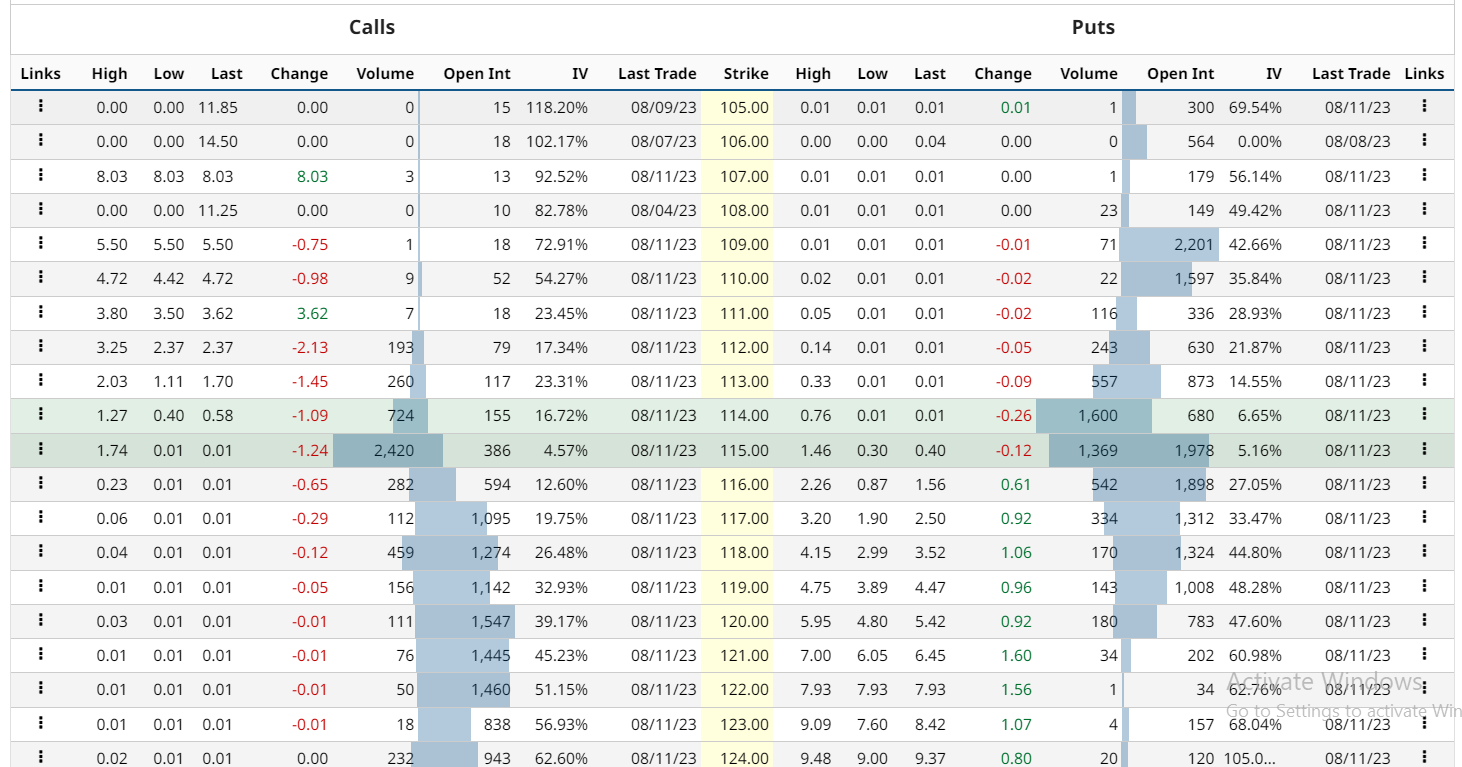
QCOM stock option-chain analysis states that the current implied volatility in the market is 29.28% with a decrement of 0.48% in the last trading session. The at-the-money strike price has 680 open contracts on the put side and 155 open contracts on the call side indicating the dominance of buyers at the current level. The PUT/CALL ratio is 1.07 indicating that PUT writers dominate the market as per the data.
QCOM Stock Price Analysis In Daily Chart
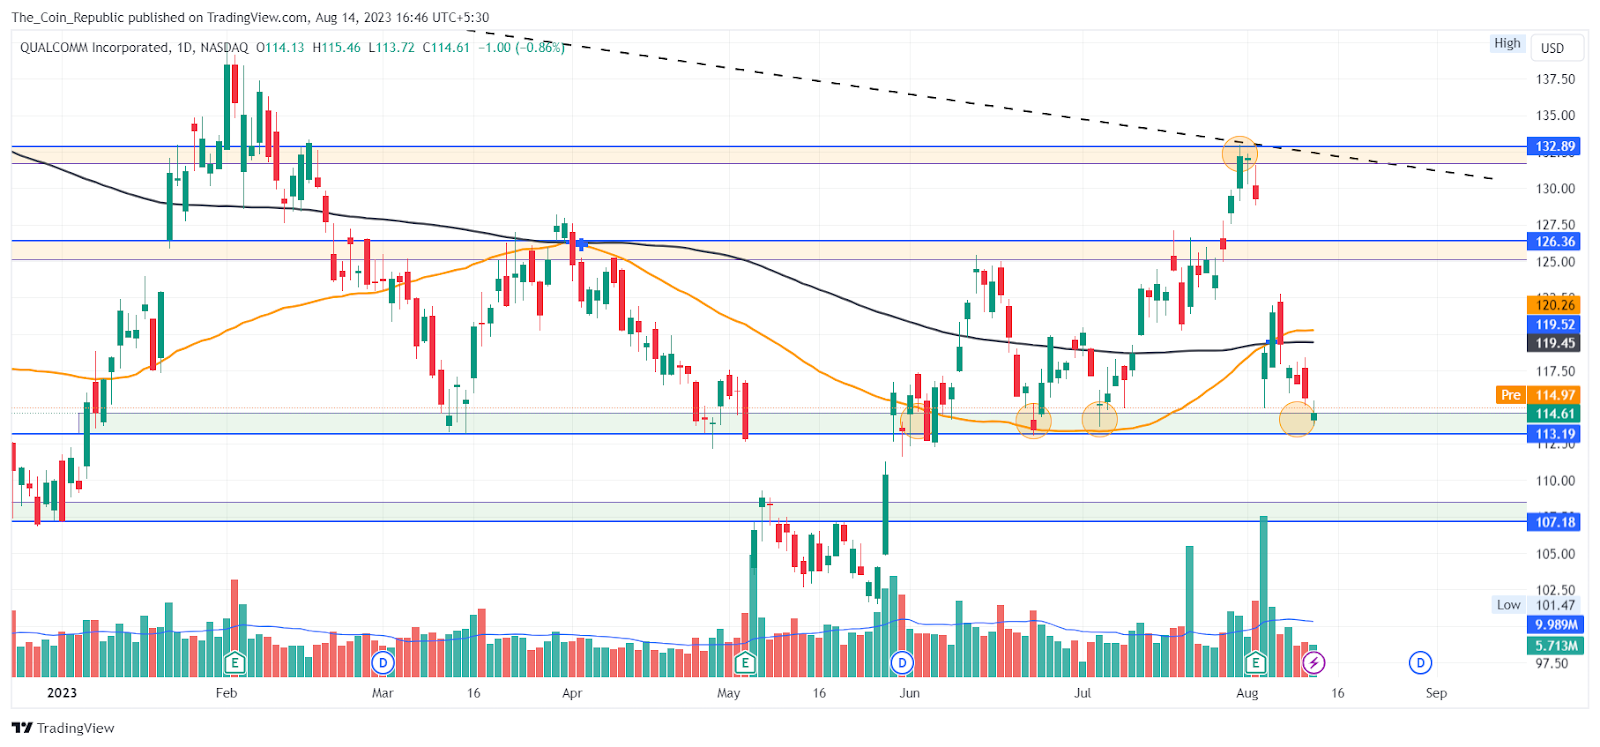
Currently, QCOM stock price currently trades at $114.61 and has declined by nearly 13% after the disclosure of the results. The Quarterly results were optimistic but the short-term gain in the stock initiated the investors to book the profits and the stock slid down.
The short-term outlook for the stock price is currently indecisive as currently, the price is trading near a demand zone from where it may get the buyers back. Now, if the buying volume adds up and the price sustains above the demand zone then the price may again soar higher in the upcoming sessions.
The long-term outlook of the price trend is positive until the price trades above the previous breakout zone. The price may decline in the short-term which may turn out to be a pullback in the longer run and the price may surge again.
The Technical Indicators showing weakness in the Short Term
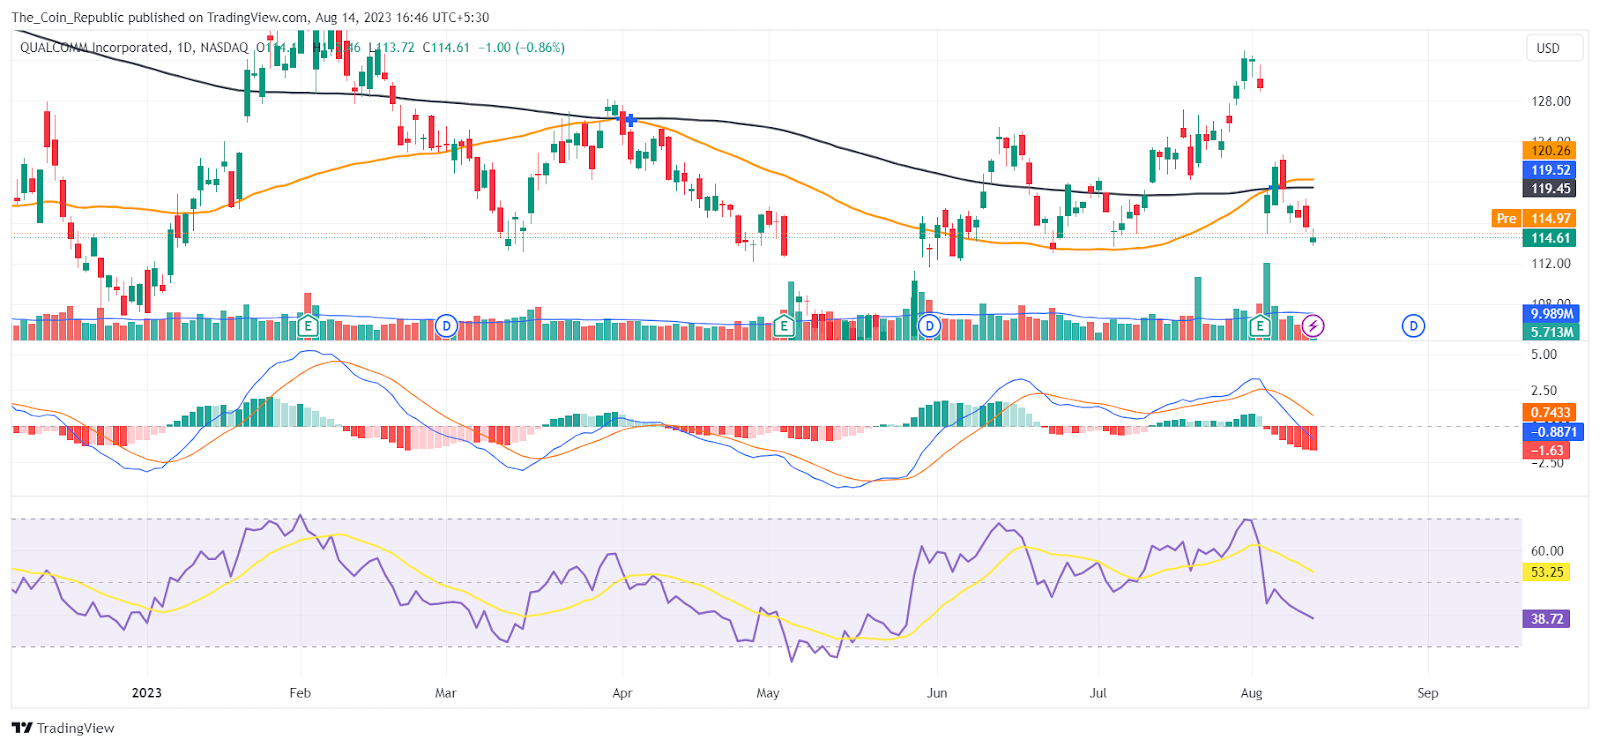
The daily QCOM stock price chart shows that the price is trading below the 50 and 200 EMA indicating a short-term weakness in the market. The overall Technical Opinion rating including RSI and MACD is signaling an 8% sell with a weakening short-term outlook on maintaining the current direction.
Conclusion
QCOM stock price prediction concludes that the price surged nearly 20% from May to July 2023, but fell 12% after quarterly results. The price is near a demand zone that may attract buyers. The short-term outlook is uncertain, depending on the buying volume. The long-term outlook is positive, as long as the price stays above the previous breakout zone. The price may bounce back after a pullback. The indicators are signaling a weakening short-term trend.
Technical Levels
- Support levels: $113.19 and $107.18.
- Resistance levels: $126.52 and $1132.89.
Disclaimer
The views and opinions stated by the author, or any people named in this article, are for informational purposes only and do not establish financial, investment, or other advice. Investing in or trading crypto or stock comes with a risk of financial loss.



