
 Bitcoin
 Solana
 Pearl
Pearl Zerebro
 Aerodrome Finance
 LayerZero
 NEAR Protocol
- The Vast stock price is currently trading at 0.31 GBX.
- The stock is in bearish sentiment.
Vast Resources Plc: Technical Analysis
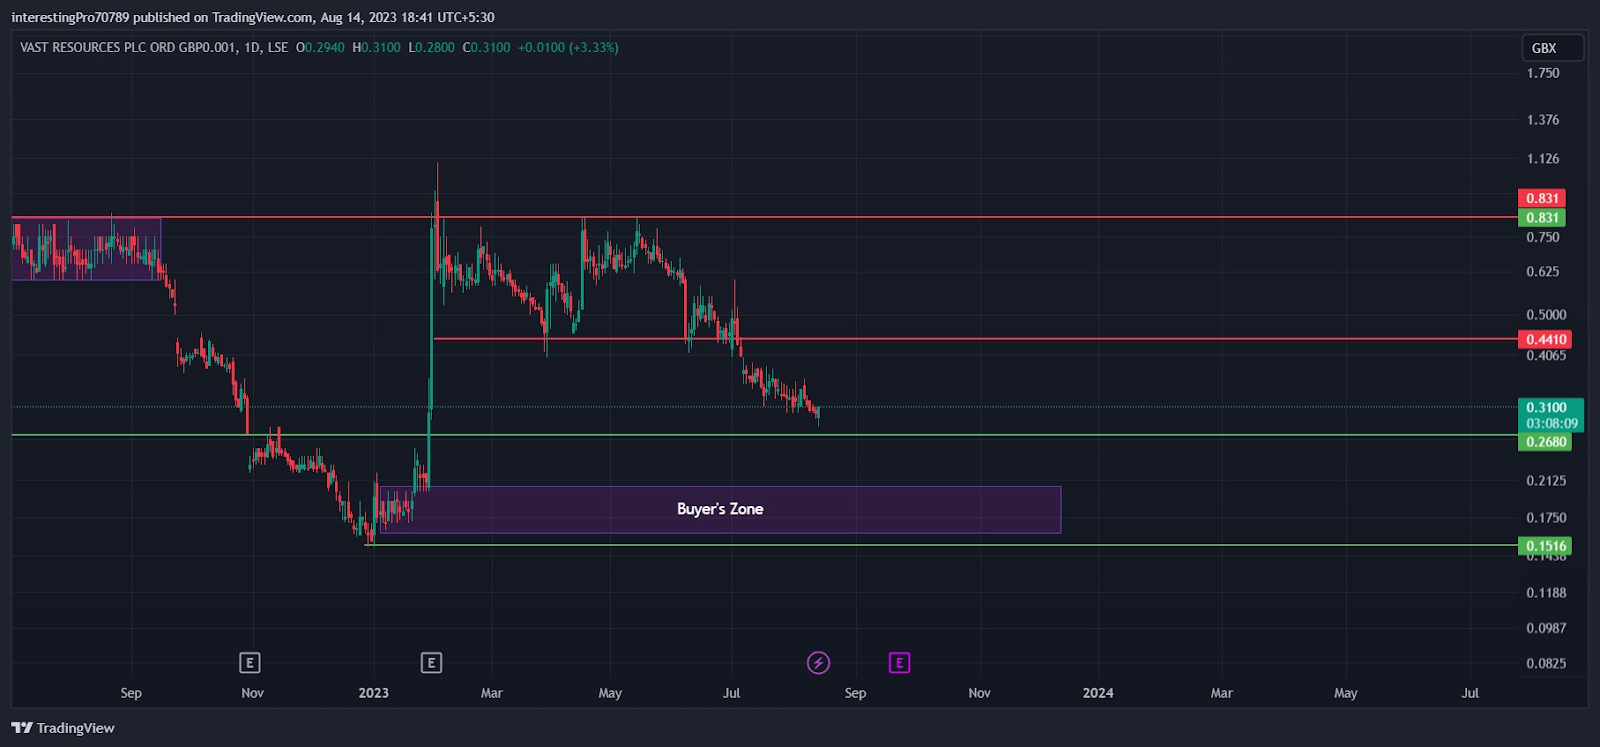
Currently, the VAST stock price is trading at GBX with an average volume of 89.171M and a market capitalization of 10.24 million.
In December 2022, the Vast stock price formed a support of 0.1516 GBX, commenced a bullish rally till 0.831 GBX and faced rejection from that level. Vast stock price tried many times to break the 0.831 GBX mark but faced rejection instead. The price was stuck in the zone range, starting from 0.831 GBX to 0.4410 GBX.
The price of Vast was stuck in the range of 0.831 GBX to 0.4410 GBX. In July, the price gave a breakdown of the 0.4410 GBX support. After which the price was seen falling. Currently, the price is just trading above the 0.2682 GBX support.
So now that Vast stock price is sustaining above 0.2680 GBX, there is still a possibility of the price moving in an upward direction. If it breaks the 0.4410 GBX resistance, then the price could be seen until 0.831 GBX, which will act as the next resistance. But if the price takes support from the 0.2680 GBX and is not able to break the 0.4410 GBX resistance and faces rejection from there, then the price would be seen taking a retest from the 0.4410 GBX resistance and could continue its downtrend till the 0.1516 GBX.
Technical Indicators And Predictions About The Current Trend
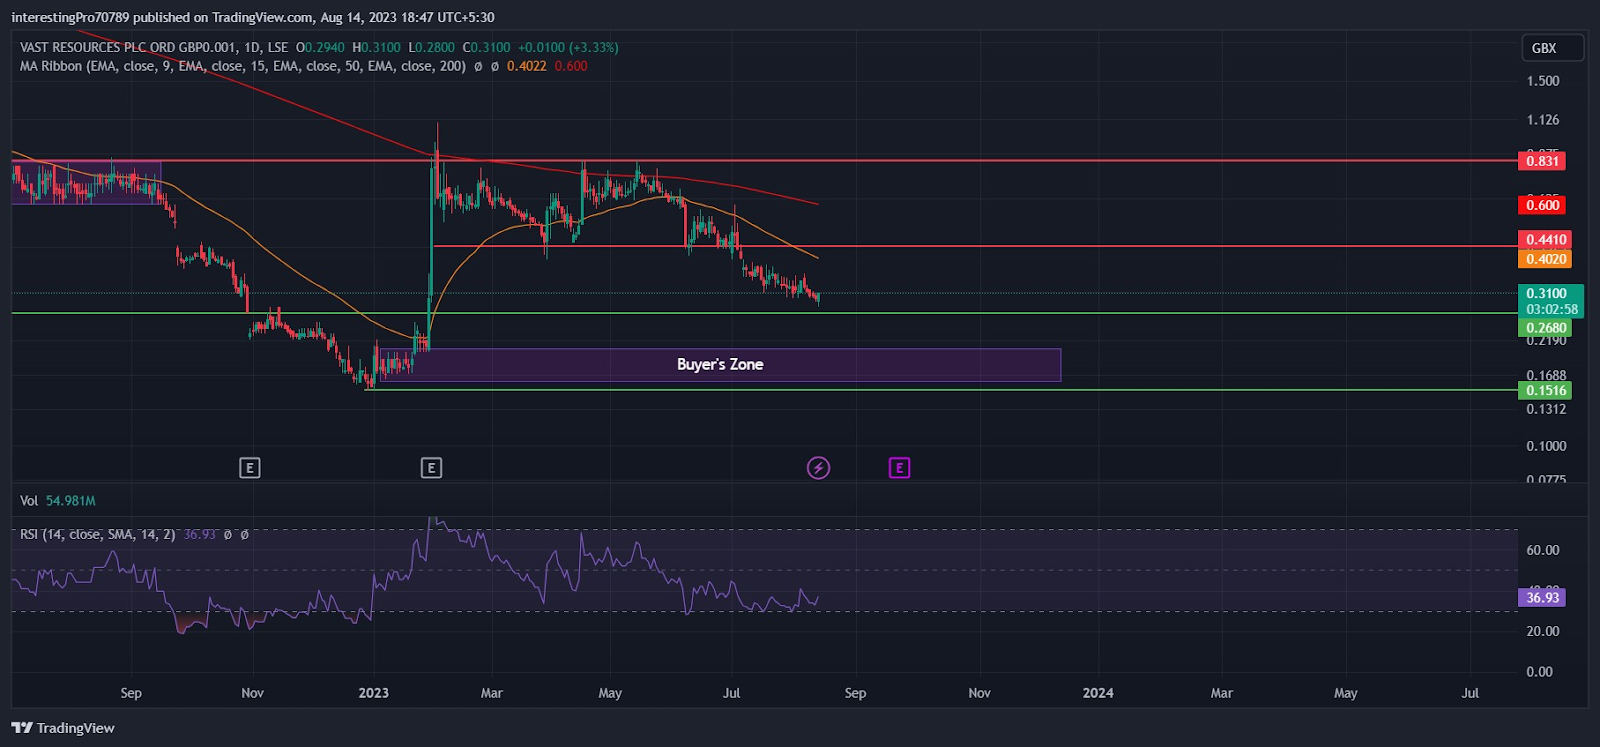
The 50 EMA (yellow line) is at 04020 GBX and the 200 EMA (red line) is at 0.600. The Vast stock price is currently trading below the 50 and 200 EMA lines, which indicates that Vast stock price is bearish and sellers are dominating in the current scenario.
Conclusion
The overall chart of Vast Resources is bearish. However, there are some positive signs that suggest that the price may be due for a pullback or retracement in the future, as the RSI line is heading towards oversold territory, which could lead to a bounce in the price of the VAST chart. The EMA is currently bearish, showing the bearish sentiment and seller’s dominance in the chart. Traders should wait for the correct level to invest their money.
Technical levels
Resistance levels: 0.4410 GBX and 0.831 GBX
Support levels: 0.2680 GBX and 0.1516 GBX
Disclaimer
The views and opinions stated by the author or any other person named in this article, are for informational purposes only. They do not provide financial, investment, or other advice. Investing in or trading crypto assets comes with a risk of financial loss.



